DEBUG
DEBUG. gdb (GNU Debugger). Debuggers are programs which allow you to execute your program in a controlled manner, so you can look inside your program to find a bug. gdb is a reasonably sophisticated text based debugger. It can let you:

DEBUG
E N D
Presentation Transcript
gdb (GNU Debugger) • Debuggers are programs which allow you to execute your program in a controlled manner, so you can look inside your program to find a bug. • gdb is a reasonably sophisticated text based debugger. It can let you: • Start your program, specifying anything that might affect its behavior. • Make your program stop on specified conditions. • Examine what has happened, when your program has stopped. • Change things in your program, so you can experiment with correcting the effects of one bug and go on to learn about another. • SYNOPSIS gdb [prog] [core|procID]
gdb • GDB is invoked with the shell command gdb. • Once started,it reads commands from the terminal until you tell it toexit with the GDB command quit. • The mostusual way to start GDB is with one argument or two, specifying an executable program as the argument: obelix[4] > gdb program • You can also start with both an executable program and acore file specified: obelix[5] > gdb program core • You can, instead, specify a process ID as a second argument, if you want to debug a running process: obelix[6] > gdb program 1234 would attach GDB to process 1234
Compiling with the –g Option • To use gdb best, compile your program with: gcc –g –c my_math.c gcc –g –c sample.c gcc –o sample my_math.o sample.o or: gcc –o sample -g my_math.c sample.c • That is, you should make sure that –g option is used to generate the .o files. • This option tells the compiler to insert more information about data types, etc., so the debugger gets a better understanding of it.
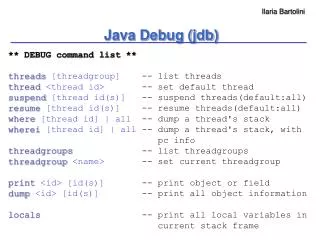
Common Commands for gdb • Here are some of the most frequently needed GDB commands: b(reak) [file:]function Set a breakpoint at function (in file). r(un) [arglist] Start program (with arglist, if specified). bt or where Backtrace: display the program stack; especially useful to find where your program crashed or dumped core. print expr Display the value of an expression. c Continue running your program (after stopping, e.g. at a breakpoint). n(ext) Execute next program line (after stopping); step over any function calls in the line. s(tep) Execute next program line (after stopping); step into any function calls in the line. help [name] Show information about GDB command name, or general information about using GDB. q(uit) Exit from GDB. l(ist) print the source code