Download
1 / 10
100 likes | 269 Vues
Simulations to test He-like forbidden-to-intercombination line ratio modeling for O, Ne, Mg, Si, S and Fe. March, 2006 M. Walter-Range Swarthmore College. According to Equation 4 in Blumenthal, Drake, and Tucker 1972, .

E N D
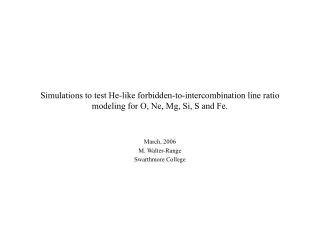
Simulations to test He-like forbidden-to-intercombination line ratio modeling for O, Ne, Mg, Si, S and Fe. March, 2006 M. Walter-Range Swarthmore College
According to Equation 4 in Blumenthal, Drake, and Tucker 1972, . The values of nc are from BDT: Oxygen: nc=3.4E10, Neon: nc=6.4E11, Magnesium: nc=6.2E12, Silicon: nc=4.0E13. The PrismSPECT modeling uses ATBASE v4.3 beta, with the “most detailed” model chosen for the He-like atomic models. The workspaces and the associated ATM files can be found at: http://astro.swarthmore.edu/~mwalter1/lab_notes/ps_workspaces
Porquet’s group did not recalculate R0 for any elements heavier than Si, so the following two plots only contain the original BDT line and the PrismSPECT values. For Sulfur: nc=1.9E14, Iron: nc=4.7E16. The largest disagreement between PrismSPECT and the BDT function occurs in the low-density limit for each of the elements shown above. However, the calculations do show agreement with the analytic expression in terms of overall shape. This includes the (effective) values for nc in PrismSPECT/ATBASE.
The following plots are the results from simulations in which the varying property was the radiation source drive temperature (and thus the UV mean intensity driving the 3S – 3P photoexcitation). I used a one-sided radiation field, and the planar option for the plasma geometry. If you would like to see the exact settings I entered into PrismSPECT, there are PowerPoint documents with screenshots for all the simulations I ran, available at: http://astro.swarthmore.edu/~mwalter1/lab_notes I have also uploaded several of the workspaces I was using. They can be found at: http://astro.swarthmore.edu/~mwalter1/lab_notes/ps_workspaces The step-by-step procedure I used is available at: http://astro.swarthmore.edu/~mwalter1/lab_notes/procedure_for_plotting_R_vs_phi.pdf This procedure is based on equations that can be found at: http://astro.swarthmore.edu/~mwalter1/lab_notes/phi_equations.pdf For each ion, I have plotted the PrismSPECT results, the original BDT model, and a BDT curve using Porquet’s newer values for R0.
Oxygen: the Dependence of f/i upon photoexcitation rate, φ The black dotted line corresponds to Blumenthal, Drake, and Tucker’s (1972) analytic model. Porquet’s results (2001) are shown as a solid black line. The individual data points are the f/i ratio calculated by PrismSPECT for a particular value of φ. The dashed blue line is a BDT-type function that fits the PrismSPECT points and determines the parameters R0 and φc. Note the excellent agreement between PrismSPECT and BDT for this element:
Neon: the Dependence of f/i upon photoexcitation rate, φ The black dotted line corresponds to Blumenthal, Drake, and Tucker’s (1972) analytic model. Porquet’s results (2001) are shown as a solid black line. The individual data points are the f/i ratio calculated by PrismSPECT for a particular value of φ. The dashed blue line is a BDT-type function that fits the PrismSPECT points and determines the parameters R0 and φc.
Magnesium: the Dependence of f/i upon photoexcitation rate, φ The black dotted line corresponds to Blumenthal, Drake, and Tucker’s (1972) analytic model. Porquet’s results (2001) are shown as a solid black line. The individual data points are the f/i ratio calculated by PrismSPECT for a particular value of φ. The dashed blue line is a BDT-type function that fits the PrismSPECT points and determines the parameters R0 and φc.
Silicon: the Dependence of f/i upon photoexcitation rate, φ The black dotted line corresponds to Blumenthal, Drake, and Tucker’s (1972) analytic model. Porquet’s results (2001) are shown as a solid black line. The individual data points are the f/i ratio calculated by PrismSPECT for a particular value of φ. The dashed blue line is a BDT-type function that fits the PrismSPECT points and determines the parameters R0 and φc.
Sulfur: the Dependence of f/i upon photoexcitation rate, φ The black dotted line corresponds to Blumenthal, Drake, and Tucker’s (1972) analytic model. The individual data points are the f/i ratio calculated by PrismSPECT for a particular value of φ. The dashed blue line is a BDT-type function that fits the PrismSPECT points and determines the parameters R0 and φc.
SummaryWe recalculate the O VII, Ne IX, Mg XI, Si XIII, and S XV forbidden-to-intercombination ratios, using the latest atomic model (ATBASE), in conjunction with PrismSPECT. Comparisons with the old analytic model of Blumenthal, Drake, and Tucker (1972) are made,as well as comparisons with the model resulting from Porquet’s newer (2001) values for R0. One significant difference is the inclusion of both of the 2 3P1,2 – 1 1S0 transitions. Note also that there is some dependence in the ‘low density limit’ (Ro) on the plasma temperature. Our simulations use a temperature that produces an ionization fraction of the He-like state that is in excess of 50% (95% for O, 97% for Ne, 55% for Mg, 89% for Si, 89% for S). Blumenthal, Drake, and Tucker do not include this effect in their model.