Mass Spectroscopy
Mass Spectroscopy. Mass spectroscopy is a powerful tool in organic chemistry that can be used to provide information about the molecular formula and structural sub units When it is combined with techniques of infrared and NMR it can be very useful in identifying unknown compounds.

Mass Spectroscopy
E N D
Presentation Transcript
Mass Spectroscopy • Mass spectroscopy is a powerful tool in organic chemistry that can be used to provide information about the molecular formula and structural sub units • When it is combined with techniques of infrared and NMR it can be very useful in identifying unknown compounds
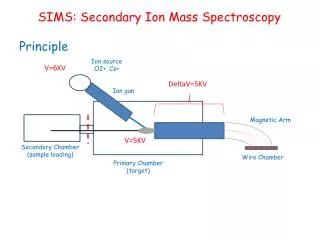
The Mass Spectrometer • The mass spectrometer contains a vacuum chamber into which a small amount of a compound is vaporized. The molecules are then bombarded by high energy electrons which cause the molecule to fragment into molecular ions
The Mass Spectrometer • The accelerated fragments are passed though a magnetic field that causes them to be deflected. The amount to which a particle isdeflected depends on its molecular mass
Mass Spectra A typical molecule may fragment in several different places. The ion formed from the loss of the electron is called the parent ion. The parent ion may fragment into smaller pieces. Each fragment is deflected to a different extent . Hence each peak appears in the Mass Spectrum
Peaks in the Mass Spectrum Butane could in four different ways, each of which forms a signal in the mass spectrum
Multiplicity of Peaks Carbon has isotopes 13C and 14C as well as 12C. Likewise there are isotopes of hydrogen including 1H, 2H and 3H. Hence a fragment with the formula CH3 has a a predominate mass of 15 but has smaller peaks representing the heavier isotopes of carbon and hydrogen
Web Site References http://www.chemguide.co.uk/analysis/masspec/mplus.html