Download
1 / 14
140 likes | 354 Vues
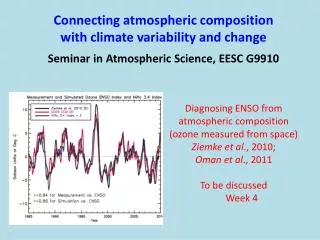
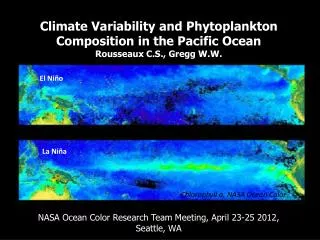
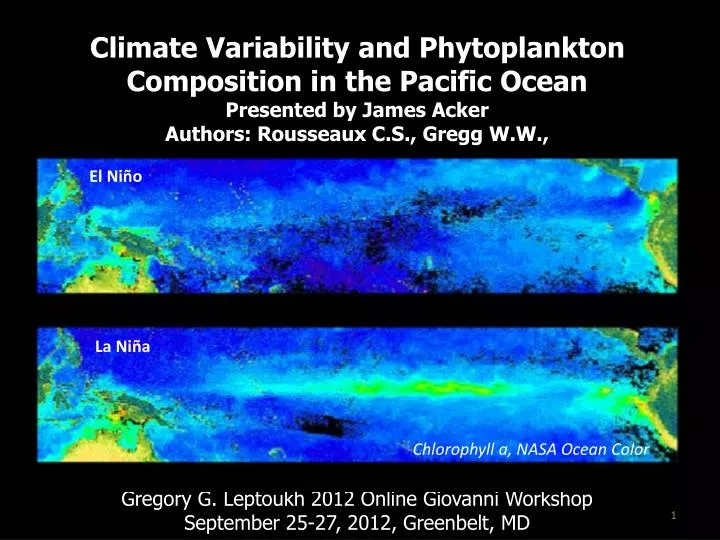
Climate Variability and Phytoplankton Composition in the Pacific Ocean Presented by James Acker Authors: Rousseaux C.S., Gregg W.W., Gregory G. Leptoukh 2012 Online Giovanni Workshop September 25-27, 2012, Greenbelt, MD. El Niño. La Niña. Chlorophyll a, NASA Ocean Color. 1997-98 El Niño.

E N D
Climate Variability and Phytoplankton Composition in the Pacific Ocean Presented by James Acker Authors: Rousseaux C.S., Gregg W.W., Gregory G. Leptoukh 2012 Online Giovanni Workshop September 25-27, 2012, Greenbelt, MD El Niño La Niña Chlorophyll a, NASA Ocean Color
1997-98 El Niño Seabird abundance and anchoveta and sardine landings from Peru (Chavez et al. 2003)
When it comes to feeding fishes, all phytoplankton are not equal… Phytoplankton (Chlorophyll a) Cyanobacteria Coccolithophores Chlorophyll a Chlorophytes Diatoms
Are El Niño conditions unfavorable to all phytoplankton groups or only some?
NASA Ocean Biogeochemical Model (NOBM) • Clouds • Precipitation water • Relative humidity • Ozone Wind Stress Wind speed pCO2 Advection pCO2 Nutrients Phytoplankton Chloro, Cocco, Cyano Diatoms Fe, NO3, NH4 Si DIC Silica Detritus Mixing Herbivores Iron Detritus N/C Detritus
Figure 2| Comparison of chlorophyll (mg m-3) from the assimilation model, the free-run model, and SeaWiFS. The assimilation and free-run chlorophyll distributions represent simulations for April 1, 2001. SeaWiFS data for the same day are shown for comparison, along with the monthly mean. Grey indicates land and coast, black indicates missing data, and white indicates sea ice.
Comparison of the free run, the multivariate and the univariate approach for chlorophyll and nutrients in the South Pacific Ocean. Time series of annual averages of (a) Chlorophyll, (b) Nitrate, (c) Silicate and (d) Iron. [Rousseaux & Gregg 2012]
How well does the NOBM compare to in situ data? Global Phytoplankton Relative Abundance 469 observations taken from figures in peer-reviewed papers; Available at GMAO Web site
How well does the NOBM compare to in situ data? Percentage difference between the NOBM and the in situ data. The number of observations used for the comparison is between parenthesis Only >20% in 3 cases
Conclusion: Climate variability has most impact on the phytoplankton community composition in the Equatorial Pacific Large Shifts are observed both on temporal and spatial scale These shifts have potential important consequences for the carbon cycles and higher trophic levels Any questions? Send me an email at Cecile.S.Rousseaux@nasa.gov This presentation is based on the results presented in Rousseaux, C.S. & Gregg, W.W. Climate variability and phytoplankton composition in the Pacific Ocean. Journal Of Geophysical Research. In print. 2012