Download
1 / 3
30 likes | 160 Vues
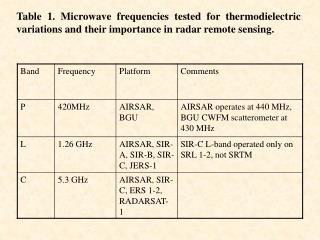
Table 1. Microwave frequencies tested for thermodielectric variations and their importance in radar remote sensing. A. B. C. D. Figure 4A-D: Fresnel reflectivities and emissivities for water and CaCl 2 solutions at q = 35 º.

E N D
Table 1. Microwave frequencies tested for thermodielectric variations and their importance in radar remote sensing.
A B C D Figure 4A-D: Fresnel reflectivities and emissivities for water and CaCl2 solutions at q = 35º
Table 2: Total dissolved solids (TDS) concentration and conductivities at 25ºC. • Data for tap and sea water from: • Marshall, T.J. and Holmes, J.W., 1992. Soil Physics. Cambridge University Press, Cambridge, England, 374 pp. • http://cities.poly.edu/environment/underedu/ce441/ph_con_tur.asp