Unleash Your Math Skills: Understanding Regression Lines Without a Calculator
130 likes | 230 Vues
Discover the concept of a "line of best fit" in scatter plots and regression analysis without relying on a calculator. Practice determining the relationship between fat grams and total calories in fast food, predicting unknown values, and honing your mathematical prediction skills in an engaging classroom setting.

Unleash Your Math Skills: Understanding Regression Lines Without a Calculator
E N D
Presentation Transcript
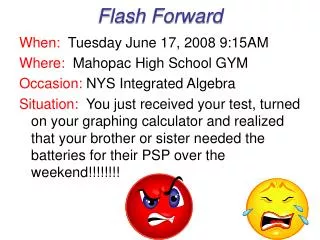
Flash Forward When: Tuesday June 17, 2008 9:15AM Where: Mahopac High School GYM Occasion: NYS Integrated Algebra Situation: You just received your test, turned on your graphing calculator and realized that your brother or sister needed the batteries for their PSP over the weekend!!!!!!!!
What do you Do? • Jump out of your seat and run screaming from the room!! • Start chatting with the other Math teachers to see who you want to take math with next year. • Start making plans for some serious payback to your sister or brother. • Remember today’s lesson that we can do regression manually!!!
What is a Line of Best Fit? • When data is displayed with a scatter plot, it is often useful to attempt to represent that data with the equation of a straight line for purposes of predicting values that may not be displayed on the plot.Such a straight line is called the "line of best fit." It may also be called a "trend" line. • A line of best fit is a straight line that best represents the data on a scatter plot. This line may pass through some of the points, none of the points, or all of the points.
Is there a relationship between the fat grams and the total calories in fast food? Can we predict the number of total calories based upon the total fat grams? Let's find out! 1. Prepare a scatter plot of the data.
Is there a relationship between the fat grams and the total calories in fast food? Can we predict the number of total calories based upon the total fat grams? Let's find out! 2. Using a straight edge, position it so it is as close to all the points as possible.
Is there a relationship between the fat grams and the total calories in fast food? Can we predict the number of total calories based upon the total fat grams? • Find two points that you think will be on the "best-fit" line. • Click to see best fit • I chose the points (9, 260) and (30, 530). You may choose different points. • Calculate the slope of the line through your two points.
Is there a relationship between the fat grams and the total calories in fast food? Can we predict the number of total calories based upon the total fat grams? • Write the equation of the line using the slope from step 5. • Substitute x and y • Solve for b. Final Regression Equation:
Is there a relationship between the fat grams and the total calories in fast food? Can we predict the number of total calories based upon the total fat grams? Final Regression Equation: Lets predict how many calories a sandwich would have if it had 22 grams of fat? So we would predict that a sandwich with 22 grams of fat would have 427 calories.:
A Word About Predictions • If you are looking for values that fall within the plotted values, you are interpolating. • If you are looking for values that fall outside the plotted values, you are extrapolating.Be careful when extrapolating. The further away from the plotted values you go, the less reliable is your prediction.
Let’s Practice with This One! Write the regression equation and predict the value of the investment 10 years after the initial purchase.
Practice with Round Robin • Each Student has a colored pencil and a piece of graph paper. • Each student does step a (draw the scatter plot) of a different problem (windows (1), doors (2) other (3) initial their work. • Pass your paper in a clockwise direction – coaches the person if the work received was incorrect, praise when correct. • Each student now completes step b (draw a line of best fit) and initials their work. • Pass your paper in a clockwise direction – coaches the person if the work received was incorrect, praise when correct. • Each student now completes step c (determine the equation of the line of best fit) and initials their work. • Pass your paper in a clockwise direction – coaches the person if the work received was incorrect, praise when correct. • Each student now completes step d and uses the prediction equation to estimate an answer and initials their work.