Download
1 / 26
260 likes | 395 Vues
TOT on CC Adaptation Session 4.1 Tools and Frameworks Using VCA & CEDRA Terry Cannon. What is VCA?. A version of PRA tools modified for disaster vulnerability We can modify it for adaptation to climate change Participatory: the people get involved – as important as the product itself

E N D
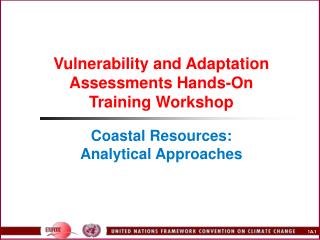
TOT on CC AdaptationSession 4.1 Tools and FrameworksUsing VCA & CEDRA Terry Cannon
What is VCA? • A version of PRA tools modified for disaster vulnerability • We can modify it for adaptation to climate change • Participatory: the people get involved – as important as the product itself • You can get quantitative data • It is a powerful way of cross-checking other information • It can help to make a questionnaire much more effective
International Federation of Red Cross VCA methodology for disaster vulnerability and capacity assessment Many other examples from NGOs etc
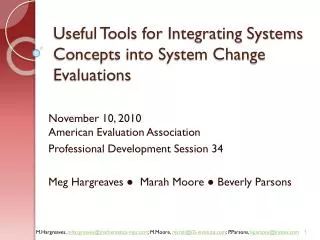
Three examples from VCA A: Community mapping B: Institution (power) mapping C: Problem tree – diagnosing causes
A: Community mapping • People in a group draw a map of their community and what is important in it • Use paper, sticks in the earth, colour pens • Should be easy for people to reach – can be on the ground but older people may not be comfy • Can do several “layers” – • basic information and vulnerabilities • Risks and hazards – all types • Resources and sources of resilience • Goal is to empower people to think about risks and risk reduction
Community mapping • Better if you do it after a transect walk or walkabout • People get involved, you can identify participants • Should allow for “spontaneous” focus groups e.g. Turkey RC Izmir – women, disabled….Can do mapping with different groups – e.g. women, children – they often show different maps and pictures • Could use simple cheap digital cameras and get people to take photos to link to map – collect results a week later
Kenya study by UNU http://www.unu.edu/unupress/food2/UIN11E/uin11e0c.htm
Using Google Earth for mapping • Images can be used to correlate with community maps • Quality of images varies a lot • You can put markers on Google Earth to log information and share it with others • In Disaster Risk Reduction this could be used to pressure for government action to reduce risks – e.g. highlighting dangerous schools
B: Institution (Power) mapping • Often uses Venn diagrams (chapati diagrams…) • Size of circle shows level of power • Various ways to show power relationships • Important to centre on the people in survey • It will involve disputes – power is about conflicts • Call it institution mapping!!
FAO example of a typical Venn diagram – it shows different sizes for various institutions and levels of power
World Bank http://images.google.co.uk/url?q=http://siteresources.worldbank.org/WBI/Resources/Analyzing_Social_Capital_in_Context-FINAL.pdf&usg=AFQjCNHu7YyqE64M4t0N0GE1QKSVZROc_Q
Benefits and drawbacks of method • Engages people – you have to think about power and influence of different actors • May be sensitive – we leave but the people are stuck there, and we may stir up a hornets nest… • Maps may use the idea of distance and space – people may take a while to understand how to use this • E.g. they may show an institution as being distant, even though it is immensely powerful
Problem Tree • Identifies factors that are important in creating a problem • Helps to identify the causes • Can be used to design projects and activities that reduce causes rather than treating the symptoms • Will help to identify what you can and cannot do • Needs for campaigns and advocacy to reduce causes
CEDRA Climate Change and Environmental Degradation Risk & Adaptation Assessment From Tearfund
Key benefits of CEDRA • It links climate problems with environmental degradation • It clarifies what the NGO project can and cannot do • Advises on how to connect with other stakeholders • Shows how to link up to scientific knowledge and local knowledge
Possible limitation • Lack of clarity on how to link disaster context with the “everyday” issue of livelihoods and climate trends and variability • But we are ALL learning on this – we can invent and modify!