Download

1 / 68
680 likes | 901 Vues
1995-2000 National Longitudinal Study of Couples. Funded by the National Institute on Alcohol Abuse and Alcoholism (R37- AA10908 ). Objectives of this Presentation. Describe cross-sectional and longitudinal results of a national study of intimate partner violence among couples.

E N D
1995-2000 National Longitudinal Study of Couples Funded by the National Institute on Alcohol Abuse and Alcoholism (R37- AA10908)
Objectives of this Presentation • Describe cross-sectional and longitudinal results of a national study of intimate partner violence among couples. • Special focus is given to crossethnic analyses of White, Black and Hispanics.
Intimate Partner Violence (IPV): A Major Public Health Problem • Emergency room visits due to intimate partner violence (Grisso et al., 1991 & 1996). • Morbidity, mental health problems associated with intimate partner violence (Stets & Straus, 1990). • Among homicides with known victim-suspect relationship, women 3 times as likely to be killed by an intimate than a stranger (Kellerman & Mercy, 1992).
Differential Risk by Ethnicity • Black women 1.2 times more likely to experience ‘minor’ violence than White women, and 2.4 times more likely to experience ‘severe’ violence (Hamptom & Gelles, 1994). • Male-to-female partner violence rates (Straus & Smith, 1990) : • Hispanic 17% • White 11%
Alcohol and IPV • Studies of battered wives found positive correlations between alcohol use, drunkenness, or drinking during the event on the part of the: • Perpetrator (Gelles, 1972; Pagelow, 1981; Walker, 1983). • Victim (Amaro et al, 1990; Berenson et al, 1991). • Both (Coleman et al, 1980; Telch and Lindquist, 1984).
Alcohol and IPV • Male & female alcoholics have higher rates of MFPV than controls (Miller et al., 1989; O’Farrell & Murphy, 1995). • Maritally aggressive male alcoholics have more binge drinking, greater problem severity, and earlier problem onset compared to their non-aggressive counterparts (Murphy & O’Farrell, 1994).
Socioeconomic Factors: Results from National Surveys • 1975 National Family Violence Survey Annual Wife Assault Rates: • blue collar men: 9.% vs. white collar men: 5% • “low” income: 16% vs. “high” income: 3.5%. • 1985 National Family Violence Survey: blue collar men had higher wife assault rate than white collar men (controlling for drinking and norms approving violence).
Socioeconomic Factors: Results from National Surveys • 1986-1987 National Survey on Families and Households: • Those with less than high school education were 40% more likely to report IPV than those with a high school diploma. • Those with household income less than $25,000 were 50-70% more likely to report IPV than those with higher $25,000-39,000.
Alcohol and Intimate Partner Violence : Causal Association? • The nature of the association is still debated: • Many aggressive events are not associated with alcohol. • It is difficult to establish a temporal relationship between drinking and aggression. • Alcohol and aggression may be both associated with a third factor (e.g., Impulsivity). • The association may be due to expectancies about the effect of alcohol.
Previous Longitudinal Studies • IPV in community samples is not as severe and not as chronic as in institutional samples: • Quigley and Leonard (1996), reported a 24% “desistance” of aggression in a sample of newly weds at 12 month follow-up. • Jasinski (2001) reported an overall rate of cessation of male aggression of 69% over 5 years.
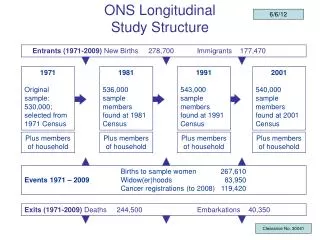
Overall Design 1635 Couples Interviewed 1995 National Survey of Couples 555 Whites, 358 Black, 527 Hispanics 85% Response rate 2577 subjects reinterviewed, 1136 intact couples. 2000 Follow-up National Survey of Couples 986 Whites, 568 Blacks, 932 Hispanics 69% Response rate
Other Methodological Features • Multistage area household probability sample. • Both partners interviewed separately. • Male-to-Female-Partner Violence (MFPV) and female-to-male partner violence (FMPV) measured with the Conflict Tactics Scale. • Upper-bound estimate used; violence considered to have occurred if either partner reports event.
Other Methodological Features • 1995: Interviews of about 1 hour with main respondents and of about 20 minutes with partner. 2000: Interviews of about 1 hour with both • Interviews conducted by trained interviewers. • Standardized questionnaire used (close ended). • Bilingual interviewers (Spanish/English) available on request. • Spanish questionnaire available on request.
Items in the Conflict Tactics Scale • Threw something (at him/her) (moderate) • Pushed, grabbed or shoved (moderate) • Slapped (moderate) • Kicked, bit or hit (severe) • Hit or tried to hit with something (severe) • Beat up (severe) • Choked (severe) • Burned or scalded (severe) • Forced sex (severe) • Threatened with a knife or gun (severe) • Used a knife or gun (severe)
Data Coverage • Alcohol consumption was assessed with a series of questions covering quantity and frequency of drinking wine, beer and spirits in the past 12 months. • Sociodemographic factors: Gender, age, income, education, marital status, place of birth, religion, employment status, occupation, number of children <17 at home, relationship length.
Data Coverage • Psychosocial factors: Childhood history of parent-perpetrated violence, witnessing violence between parents, approval of marital aggression, impulsivity, risk taking. • Acculturation. • Drug use. • Residential addresses matched to Census Tract number. 1990 Census data appended to the geocoded sample in 1995.
Couple’s Level of Agreement in Reporting Intimate Partner Violence (Kappa)
Rates of Intimate Partner Violence in the U.S.: Lower and Upper Bound Estimates
Two Different Ways to Report the Prevalence of Intimate Partner Violence FMPV FMPV Only Both MFPV No No MFPV Only
Overall Rates of Male to Female Partner Violence * * Chi-square across ethnic groups: * p < .01
Type of Male to Female Partner Violence * * * * Push Slap Kick Hit With Beat Choke Burn Sex Threat/ Knife or Gun Use/ Knife or Gun Throw * Chi-square across ethic groups: p < .05
Type of Female to Male Partner Violence * * * * * Push Slap Kick Hit With Beat Choke Burn Sex Threat/ Knife or Gun Use/ Knife or Gun Throw * Chi-square across ethnic groups: p < .05
Severe Unidirectional and Bidirectional Intimate Partner Violence
Proportional Representation of MFPV Only, FMPV Only and Bidirectional Violence Among IPV Cases
Male to Female Partner Violenceby Drinking Patterns Chi-square: p:ns
Female to Male Partner Violenceby Drinking Patterns Chi-square: Black - p<.001, Hispanic - p<.05
Association Between IPV and Ethnicity: Multiple Logistic Regression • Ethnicity was not a significant predictor of MFPV. For FMPV, Blacks were nearly twice as likely to engage in FMPV as Whites: • OR: 1.91 (95% CI = 1.13 - 3.24).
Odds Ratios from Multiple Logistic Regression on Male to Female Partner Violence
Odds Ratios from Multiple Logistic Regression on Female to Male Partner Violence
Odds Ratios from Multiple Logistic Regression on MFPV and FMPV
Overall Rates of Intimate Partner Violence Among U.S. Hispanics by Acculturation * * Chi-square: p <.01
Odds ratios and from Multiple Logistic Regression: Acculturation and IPV.
Association Between IPV and Expectancies OR (Strong/very strong vs. no: 3.2 (1.3-7.9). Controlling for gender, age, ethnicity, income, attitudes towards IPV, impulsivity, excuses.
Factors Associated with Intimate Partner Violence • Risk factors for MFPV: Young age, lower income, unemployment, childhood physical abuse, approval of aggression, alcohol problems, neighborhood poverty. • Risk factors for FMPV: Young age, childhood physical abuse, alcohol, number of children, approval of aggression, alcohol problems, neighborhood poverty.
Initial Research Questions • What is the prevalence of IPV across ethnic groups in 1995 and 2000? • What is the stability, remission and incidence of IPV across ethnic groups? • What is the course of IPV (no violence to moderate to severe violence) across ethnic groups? • What are the predictors of stability, remission and incidence?
Eligible Individuals for 2000 Follow-up Survey N = 3,270 Dead or Incapacitated N = 124 Capable of Re-interview N = 3,146 Interviewed N = 2,577 Not Interviewed N = 569 Excluded from the Analysis N = 35 Excluded from the Analysis N = 5 Final Respondents included in the Analysis N = 2,542 Final Non-Respondents in the Analysis N = 564 Number of Respondents Eligible for Reinterview in 2000 Follow up
Non-Response Analysis • Non-respondents were more likely to be: Younger men (18-29), unemployed men, women 40 to 49. • Women who experienced abuse during their childhood were less (OR=0.6) likely to be among non-respondents. • Gender-specific multivariate logistic regression models accounted for only 5% of the variance in survey participation.
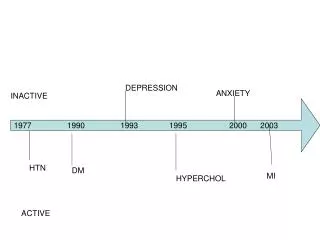
Potential Courses for Violence Type: 1995 to 2000 1995 FMPV Both MFPV No 2000
Prevalence of Intimate Partner Violence: 1995 and 2000 (1) * * * Chi-square: p>.01 (1) Intact Couples Only
Stability and Incidence of Intimate Partner Violence (1) * ** • *Chi-square: Hispanic vs. White, p>.01 • **chi-square: p>.01 (1) Intact Couples Only
Proportion of Incident and Stable Cases of IPV in 2000 among All IPV Cases by Ethnicity Hispanic Black White
Odds Ratios from Multinomial Logistic Regression: Ethnicity Effects a * Significant at p<.05 a Also controlling for: female and male alc. prob, drug use, childhood victim., parental violence, impulsivity, attit. toward violence, age, income, education, emplm. status, marital status, length of relationship, weekly N of drinks, drk 5 or +.
Odds Ratios from Multinomial Logistic Regression: Drinking Variables a * p<0.05, **p<0.01 a Also controlling for: female and male alc. prob, drug use, childhood victim., parental violence, impulsivity, attit. toward violence, age, income, education, emplm. status, marital status, length of relationship, ethnicity.
Odds Ratios from Multinomial Logistic Regression: Alcohol Problems a * Significant at p<.05 a Also controlling for: drug use, childhood victim., parental violence, impulsivity, attit. toward violence, age, income, education, emplm. status, marital status, length of relationship, ethnicity, weekly N drks, 5 or +.