Download
1 / 12
120 likes | 322 Vues
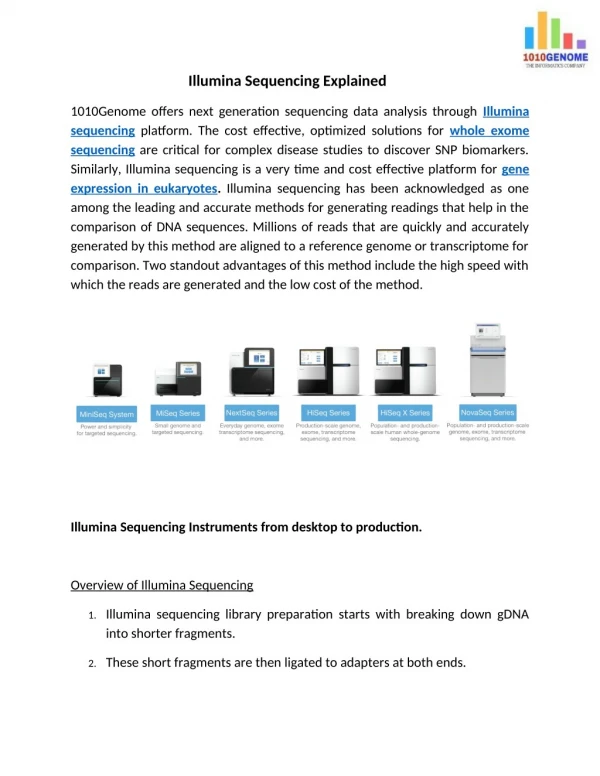
Analysis of Chiara's 7/7 109/109 DN-Rest Illumina Data. Data is in /home/cassj/work/chiara/dn_rest/illumina_arrays Input illumina file is: Huntington_REST_Sample_Probe_Profile.txt analysis script is: analysis.R KY has already done bg correction, which means a lot of the data is -ve.

E N D
Data is in /home/cassj/work/chiara/dn_rest/illumina_arrays Input illumina file is: Huntington_REST_Sample_Probe_Profile.txt analysis script is: analysis.R KY has already done bg correction, which means a lot of the data is -ve. If we use the detection scores, with KY's filter of >=0.8 in 2/12, only 7948 of 46147 probes pass. This seems low? For KY's analysis: normalise to the 75%ile. There's quite a lot of variation across arrays for this. > chip.percentile 1488790161_A 1488790161_B 1488790161_C 1488790161_D 1488790161_E 1488790161_F 72.10 61.90 53.00 65.55 46.30 45.10 1488790153_A 1488790153_B 1488790153_C 1488790153_D 1488790153_E 1488790153_F 98.90 94.60 87.45 105.70 77.60 73.90 I then ran welch's t-tests on CtrlvCtrl 109DNvEV and corrected the p-values for multiple testing using the Benjamini-Hochberg FDR
Ctrl 109 / Ctrl 7: FC t.test p.val FDR SSave OONave P.4200487 147.05494824 670.8401 7.168548e-06 0.6589553 0.1847976 27.1754067 P.1770047 0.07103192 -456.4951 7.416485e-06 0.8448034 1.4558278 0.1034102 P.2900372 0.61528690 -346.8312 8.342124e-06 0.4949114 6.8309317 4.2029828 P.2760280 1.57643493 638.9648 2.187778e-05 0.2505329 26.4837642 41.7499311 P.4920025 0.07006205 -268.2637 2.371970e-05 0.5618198 35.7394000 2.5039755 1488790161_A 1488790161_B 1488790153_A 1488790153_B P.4200487 0.2080444 0.1615509 27.1425683 27.2082452 P.1770047 1.4576976 1.4539580 0.1011122 0.1057082 P.2900372 6.8363384 6.8255250 4.2082912 4.1976744 P.2760280 26.4715673 26.4959612 41.7704752 41.7293869 P.4920025 35.6629681 35.8158320 2.4064712 2.6014799 Nothing significant at FDR 0.05. And by the looks of the second top hit we're hitting problems with significance of small fold changes, small variance cases, Perhaps he's filtered on fc2 or something and not mentioned it?
109DNRest / 109 Empty Vector > tests.oondnev[1:5,] FC t.test p.val FDR OON.DNave OON.EVave P.7050576 1.6092717 70.19242 0.0004935415 0.3652400 0.5954445 0.3700087 P.105220156 1.2667951 400.75759 0.0005197383 0.3652400 0.5102291 0.4027716 P.6650592 0.5558218 -40.61034 0.0006109662 0.3652400 1.1441730 2.0585249 P.4060019 1.2209651 43.34967 0.0006899963 0.6728637 17.6065254 14.4201712 P.4810609 1.3170319 287.27831 0.0007398914 0.3652400 2.2507812 1.7089801 1488790153_E 1488790153_F 1488790153_C 1488790153_D P.7050576 0.5927835 0.5981055 0.3682104 0.3718070 P.105220156 0.5103093 0.5101488 0.4025157 0.4030274 P.6650592 1.1597938 1.1285521 2.0423099 2.0747398 P.4060019 17.6636598 17.5493911 14.3739280 14.4664144 P.4810609 2.2525773 2.2489851 1.7084048 1.7095553 Again, nothing sig by FDR
Limma: Design matrix: #> design # ctrl.SS EV.SS DNRest.SS ctrl.OON EV.OON DNRest.OON #1488790161_A 1 0 0 0 0 0 #1488790161_B 1 0 0 0 0 0 #1488790161_C 0 1 0 0 0 0 #1488790161_D 0 1 0 0 0 0 #1488790161_E 0 0 1 0 0 0 #1488790161_F 0 0 1 0 0 0 #1488790153_A 0 0 0 1 0 0 #1488790153_B 0 0 0 1 0 0 #1488790153_C 0 0 0 0 1 0 #1488790153_D 0 0 0 0 1 0 #1488790153_E 0 0 0 0 0 1 #1488790153_F 0 0 0 0 0 1 Contrasts Matrix: Contrasts Levels ctrl.OON - ctrl.SS DNRest.OON - EV.OON ctrl.SS -1 0 EV.SS 0 0 DNRest.SS 0 0 ctrl.OON 1 0 EV.OON 0 -1 DNRest.OON 0 1
The full results (F test and contast t-test pvalues and FDRs) are in limma.fit.csv This time we do get some significant changes (these are just the top 5s for illustration) Ctrl 109 v Ctrl 7 ID logFC t P.Value adj.P.Val B 24859 P.6620402 -7.875939 -309.1293 9.798812e-15 4.521858e-10 16.74017 30070 P.6180286 12.905237 252.6184 3.617576e-14 8.347014e-10 16.64870 20047 P.6620128 -13.537963 -214.9810 1.027333e-13 1.580277e-09 16.54654 23446 P.5720019 9.583632 180.9335 3.134315e-13 2.874210e-09 16.39904 3782 P.104670273 -12.978006 -178.6939 3.397322e-13 2.874210e-09 16.38656 109 DN v 109 EV ID logFC t P.Value adj.P.Val B 38577 P.1500465 -6.673352 -219.3428 9.021418e-14 2.319905e-09 10.34777 18228 P.1190563 -5.470312 -215.6979 1.005442e-13 2.319905e-09 10.34604 8492 P.106840671 -5.910898 -134.2160 2.163901e-12 3.328585e-08 10.26431 11165 P.105360601 -3.178506 -126.9037 3.108905e-12 3.358470e-08 10.24870 16634 P.4050195 -5.166674 -123.8526 3.638882e-12 3.358470e-08 10.24138
I annotated the results by mapping the probe id to the illumina id (from the original data file), the illumina ID to ensembl ID and from there to everything else. As ensembl maps everything at the transcript level, the results I got back from biomart for the annotation had multiple entries for each transcript of a gene to which an illumina ID mapped. We don't really care about this at this stage, so where we have multiple annotation entries for a single illumina ID I used the following strategy to narrow it down: 1. As long as all the entries for the illumina ID map to the same gene, just grab the first one with an annotation and use that. 2. Any remaining cases where an illumina ID has multiple entries are cases where the probe maps to multiple ensembl genes. On the assumption that the results from such probes are indecipherable, I have just annotated them as cross-hybridising. There are an alarming number of cases for which we can't get any information from Ensembl. Maybe we would be better to use Illumina annotation? Will look into it. #> length(test2) #[1] 46120 #> length(which(test2%in%test)) #[1] 29109
Ctrl v Ctrl Just checking the data are still the same: FC t.test p.val FDR SSave OONave P.4200487 147.05494824 670.8401 7.168548e-06 0.6589553 0.1847976 27.1754067 P.1770047 0.07103192 -456.4951 7.416485e-06 0.8448034 1.4558278 0.1034102 P.2900372 0.61528690 -346.8312 8.342124e-06 0.4949114 6.8309317 4.2029828 P.2760280 1.57643493 638.9648 2.187778e-05 0.2505329 26.4837642 41.7499311 P.4920025 0.07006205 -268.2637 2.371970e-05 0.5618198 35.7394000 2.5039755 TargetID ProbeID ensembl_gene_id mgi_symbol P.4200487 scl32000.4_245-S P.4200487 ENSMUSG00000030847 Bag3 P.1770047 scl44852.5.1_6-S P.1770047 ENSMUSG00000021367 Edn1 P.2900372 scl24399.13_176-S P.2900372 ENSMUSG00000028467 x-hyb P.2760280 scl00214572.1_279-S P.2760280 ENSMUSG00000060098 Prmt7 P.4920025 scl27591.6.1_80-S P.4920025 ENSMUSG00000029378 Areg results are in ky.ctrl.vs.ctrl.csv and ky.oondnev.csv
I also tried filtering on detection score of >=0.8 in 2/12, as Kee Yew did Results are in tests.ctrlvctrl.det.csv and tests.oondnev.det 28398 of 46147 pass the detection filter. Same thing for the limma data, annotated results are in: ctrl_vs_ctrl.csv and 109_dn_vs_ev.csvctrl_vs_ctrl_det.csv and 109_dn_vs_ev.csv also, wrote out the normalised and raw expression data as expn.csv and raw.csv I then looked at the overlap between the two lists. For Kee Yew's protocol, I used a significance cut off of p<0.05 as a similar FDR cut-off yields no hits. Result is in: ky_overlap_ctrlvctrl_vs_dnvevp05.csv and ky_overlap_ctrlvctrl_dnevp05_det.csv Similarly for the limma data, results are in: limma_overlap_ctrlvctrl_vs_dnvevp05.csv limma_overlap_ctrlvctrl_vs_dnvevfdr05.csv limma_overlap_ctrlvctrl_vs_dnvev_det_p05.csv limma_overlap_ctrlvctrl_vs_dnvev_det_fdr05.csv Note that using the detection scores doesn't make much difference with limma.
I then cross-referenced the overlap lists with the ESC ChIPPET data to see how many of our identified genes have annotated RE1 sites. In the results files, I have just added a col to say whether or not there is a PET site. Full data about the sites can be found in the file: ~/work/REST_data/esc_mm9_re1_chippet_with_ensembl.csv Kee Yew results are in: ky_overlap_ctrlvctrl_vs_dnvevp05_PET.csv ky_overlap_ctrlvctrl_vs_dnvevp05_det_PET.csv Limma results are in: limma_overlap_ctrlvctrl_vs_dnvevfdr05_PET.csv limma_overlap_ctrlvctrl_vs_dnvevp05_PET.csv limma_overlap_det_ctrlvctrl_vs_dnvevfdr05_PET.csv limma_overlap_det_ctrlvctrl_vs_dnvevp05_PET.csv
Problem: My results seem very different from Kee Yew's original list and I can't figure out what I've done differently. Assuming he used a cut-off of p=0.05 to determine his significant list (if he used FDR I'm already different as I get no significant genes) Also not that many of the results are direct targets of Rest according to the ChIPPET data, but I suppose we have to bear in mind that this was done in a different cell line, and that there will presumably be downstream consequences of blocking Rest action. More worryingly, Bdnf doesn't show up in my list and it does in Kee Yew's original list. bdnf.probes: [1] "scl20503.8_119-S" "scl0003178.1_188-S" "scl0003087.1_7-S" [4] "scl0003101.1_255-S" "scl0003056.1_59-S" "scl0003353.1_0-S" The only one which is picked up as significant in Kee Yew's list is scl0003178.1_188-S and in this case, the raw expression values are quite low: 7ctrl1.xpn 7ctrl2.xpn 109ctrl1.xpn 109ctrl2.xpn 5.4 3.1 26.4 49.3 109ev1.xpn 109ev2.xpn 109dn1.xpn 109dn2.xpn 10 14.9 27.7 36.9 Also, isn't the idea that Bdnf is down in 109, not up? And then rescued in dn (which it is). Not convinced that this is something we should judge the quality of the analysis on.
Bdnf passes the detected filter and it gets the following scores: ky ctrlvctrl: FC t.test p.val FDR SSave OONave 1488790161_A P.3520368 2.624764 1.911333 0.3038129 0.2505329 0.1501236 0.394039 0.1386963 1488790161_B 1488790153_A 1488790153_B TargetID ProbeID P.3520368 0.1615509 0.2669363 0.5211416 scl0003178.1_188-S P.3520368 ensembl_gene_id illumina_v1 mgi_symbol P.3520368 ENSMUSG00000048482 scl0003178.1_188-S Bdnf ky dn v ev FC t.test p.val FDR OON.DNave OON.EVave 1488790153_E P.3520368 3.353813 4.149433 0.1379837 0.36524 0.4281411 0.1276580 0.3569588 1488790153_F 1488790153_C 1488790153_D TargetID ProbeID P.3520368 0.4993234 0.1143511 0.140965 scl0003178.1_188-S P.3520368 ensembl_gene_id illumina_v1 mgi_symbol P.3520368 ENSMUSG00000048482 scl0003178.1_188-S Bdnf limma ctrl v ctrl logFC t P.Value adj.P.Val TargetID ProbeID P.3520368 2.588330 2.160725 0.07070685 0.3636869 scl0003178.1_188-S P.3520368 ensembl_gene_id illumina_v1 mgi_symbol P.3520368 ENSMUSG00000048482 scl0003178.1_188-S Bdnf limma dn v ev logFC t P.Value adj.P.Val TargetID ProbeID P.3520368 1.296571 1.082371 0.3177672 1 scl0003178.1_188-S P.3520368 ensembl_gene_id illumina_v1 mgi_symbol P.3520368 ENSMUSG00000048482 scl0003178.1_188-S Bdnf