Comprehensive Quality Control for Illumina Sequencing Data
190 likes | 358 Vues
This overview by Mick Watson from ARK Genomics at The Roslin Institute outlines the principles and methods for assessing the quality of Illumina sequencing data. It discusses the significance of quality scores, specifically the Sanger Q score, and how these scores relate to the probability of base call errors. Key metrics, such as Q20 and Q30, are emphasized, illustrating their implications for data reliability. Tools like FastQC are highlighted for visualizing quality distributions and identifying potential sequencing issues. Gain insights into quality encoding and enhance your bioinformatics workflow.

Comprehensive Quality Control for Illumina Sequencing Data
E N D
Presentation Transcript
Quality Control of Illumina Data Mick Watson Director of ARK-Genomics The Roslin Institute
Quality scores • The sequencer outputs base calls at each position of a read • It also outputs a quality value at each position • This relates to the probability that that base call is incorrect • The most common Quality value is the Sanger Q score, or Phred score • Qsanger -10 * log10(p) • Where p is the probability that the call is incorrect • If p = 0.05, there is a 5% chance, or 1 in 20 chance, it is incorrect • If p = 0.01, there is a 1% chance, or 1 in 100 chance, it is incorrect • If p = 0.001, there is a 0.1% chance, or 1 in 1000 chance, it is incorrect • Using the equation: • p=0.05, Qsanger= 13 • p=0.01, Qsanger= 20 • p=0.001, Qsanger= 30
For the geeks…. • In R, you can investigate this: sangerq<- function(x) {return(-10 * log10(x))} sangerq(0.05) sangerq(0.01) sangerq(0.001) plot(seq(0,1,by=0.00001),sangerq(seq(0,1,by=0.00001)), type="l")
For the geeks…. • And the other way round…. qtop<- function(x) {return(10^(x/-10))} qtop(30) qtop(20) qtop(13) plot(seq(40,1,by=-1), qtop(seq(40,1,by=-1)), type="l")
The important stuff • Q30 – 1 in 1000 chance base is incorrect • Q20 – 1 in 100 chance base is incorrect
Quality Encoding • Bioinformaticians do not like to make your life easy! • Q scores of 20, 30 etc take two digits • Bioinformaticians would prefer they only took 1 • In computers, letters have a corresponding ASCII code: • Therefore, to save space, we convert the Q score (two digits) to a single letter using this scheme
The process in full • p(probability base is wrong) : 0.01 • Q (-10 * log10(p)) : 30 • Add 33 : 63 • Encode as character : ?
For the geeks…. code2Q <- function(x) { return(utf8ToInt(x)-33) } code2Q(".") code2Q("5") code2Q("?") code2P <- function(x) { return(10^((utf8ToInt(x)-33)/-10)) } code2P(".") code2P("5") code2P("?")
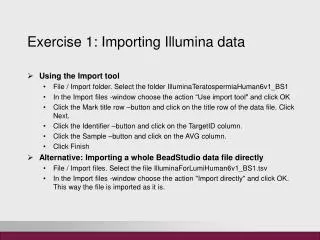
FastQC • FastQC is a free piece of software • Written by Babraham Bioinformatics group • http://www.bioinformatics.babraham.ac.uk/projects/fastqc/ • Available on Linux, Windows etc • Command-line or GUI
Read the documentation Follow the course notes
Per sequence quality • One of the most important plots from FastQC • Plots a box at each position • The box shows the distribution of quality values at that position across all reads
Other useful plots • Per sequence N content • May identify cycles that are unreliable • Over-represented sequences • May identify Illumina adapters and primers