Data Processing & Quality Control
The Quality Control (QC) Group, led by Reinhard Hanuschik, oversees the processing and certification of astronomical data from VLT and VLTI instruments. With a team of 7+ QC scientists, we ensure all scientific data can be calibrated accurately, interacting closely with operations and user support. We process approximately 50,000 jobs monthly, handling 6 TB of raw data and creating 0.8 TB of product data. Our quasi-real-time QC monitoring and automated calibration checks maintain high standards. Data packages are promptly archived, available for Principal Investigators, ensuring streamlined access to vital astronomical data.

Data Processing & Quality Control
E N D
Presentation Transcript
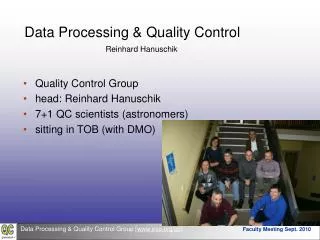
Data Processing & Quality Control Reinhard Hanuschik • Quality Control Group • head: Reinhard Hanuschik • 7+1 QC scientists (astronomers) • sitting in TOB (with DMO)
pipeline-process all VLT+VLTI data • certify calibration products, store in archive • process science data, store in archive • create data packages for PIs • QC mission: ensure that science data can be calibrated, to a known and documented level
supported: • all Paranal instruments:11 VLT, 2 VLTI instruments, plus survey telescopes (VISTA, OCAM) • close interaction with: • Paranal Science Operations • User Support • other groups at DPD (External Data Products, Science Data Products) • Archive Department
statistics per month: • 50.000 processing jobs (20.000 VLT, 30.000 VIRCAM) (+150% in 2 years) • 6 TB raw data processed • 0.8 TB product data created and archived • 120 SM data packages • 300 DVDs • processing: • on 13 dual-core blades, plus • on a cluster of 20 dual-core blades (VIRCAM, HAWKI, OCAM)
how do data get here? • data transfer Paranal – Antofagasta – Santiago – Garching • microwave link: now at 10 Mbits/sec • sufficient for all VLT(I) data plus VIRCAM calibrations • most raw files available in archive within minutes • next step: fibre link Paranal – Antofagasta (EVALSO, 2010/2011)
how is QC making use of it?process calibration data: incremental and automatic processing • once per hour: look for new CALIB data • pipeline-process them in the QC way (dynamic associations within pool of data, fine-tuned processing parameters etc.) • create QC reports • calculate scores • put this information on the web • do this 24 hrs a day, 7 days a week quasi-real time quality control and feedback • evaluated by: • QC scientist • Paranal daytime or nighttime astronomer • QC does review/certification (off-line)
for comparison: healthy situation HC monitor link: www.eso.org/HC
certification / rejection: interaction & analysis by QC scientist
QC review and certification • this is done off-line (Mon-Fri, 5/2) • score-based • review all red scores, plus selected green scores • analyze issues • reject or certify • communicate with PSO • certified master calibrations go into archive
trending of all core instrument components • for complete history of instrument one QC data point = one calibration product
quick-look: score version • concentrates on compliance with predefined thresholds • numerical values replaced by scores: simple and graphical • hierarchical score scheme instrument score
Health Check monitor: • central tool for quality feedback to Paranal SciOps • closes the feedback loop: raw – pipeline – scores - HC • up-to-date at timescale of 1 hour • based mostly on CALIB information (daytime, nighttime) • includes also SCIENCE information (image quality; VIRCAM: zero points)
The process for SCIENCE data • pipeline-processing: off-line • all pipeline supported instrument modes (40-50) • SM or VM: does not matter • use certified master calibrations • no strict certification process (on-line quality is graded ABCD by SciOps); feedback about quality problems or uncalibrated OBs given to USD and SciOps • products are ingested into archive • data packages are stored on the User Portal and available there for PIs • timescale for User Portal availability to PIs: • raw data within minutes after acquisition • product data within days (or faster)
processing level of SCIENCE data • pipelines: originally mainly for quality control and quick look • goal: remove instrumental and atmospheric signatures • strong push from community towards science-grade quality • sheer volume of raw data • complexity of data reduction • push pipelines and calibration plans towards science-grade products (SDP) • to be implemented within the QC scheme: mass production with pipelines, not fine-tuned towards specific scientific goal
calChecker: automatic interface to check completeness of calibrations • again: feedback scale less than one hour • 24/7 • checks completeness of all calibrations formally required for science, within validity range calChecker live