Exponential Functions Section 4.1
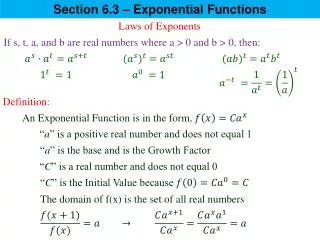
Exponential Functions Section 4.1. JMerrill, 2005 Revised 2008. Definition of Exponential Functions. The exponential function f with a base b is defined by f(x) = b x where b is a positive constant other than 1 (b > 0, and b ≠ 1) and x is any real number. So, f(x) = 2 x , looks like: .

Exponential Functions Section 4.1
E N D
Presentation Transcript
Exponential FunctionsSection 4.1 JMerrill, 2005 Revised 2008
Definition of Exponential Functions • The exponential function f with a base b is defined by f(x) = bx where b is a positive constant other than 1 (b > 0, and b ≠ 1) and x is any real number. • So, f(x) = 2x, looks like:
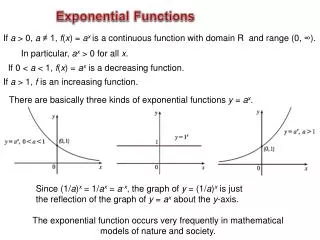
Graphing Exponential Functions • Four exponential functions have been graphed. Compare the graphs of functions where b > 1 to those where b < 1
So, when b > 1, f(x) has a graph that goes up to the right and is an increasing function. When 0 < b < 1, f(x) has a graph that goes down to the right and is a decreasing function. Graphing Exponential Functions
Characteristics • The domain of f(x) = bx consists of all real numbers (-, ). The range of f(x) = bx consists of all positive real numbers (0, ). • The graphs of all exponential functions pass through the point (0,1). This is because f(o) = b0 = 1 (bo). • The graph of f(x) = bx approaches but does not cross the x-axis. The x-axis is a horizontal asymptote. • f(x) = bx is one-to-one and has an inverse that is a function.
Transformations • Vertical translation f(x) = bx + c • Shifts the graph up if c > 0 • Shifts the graph down if c < 0
Transformations • Horizontal translation: g(x)=bx+c • Shifts the graph to the left if c > 0 • Shifts the graph to the right if c < 0
Transformations • Reflecting • g(x) = -bx reflects the graph about the x-axis. • g(x) = b-x reflects the graph about the y-axis.
Transformations • Vertical stretching or shrinking, f(x)=cbx: • Stretches the graph if c > 1 • Shrinks the graph if 0 < c < 1
Transformations • Horizontal stretching or shrinking, f(x)=bcx: • Shinks the graph if c > 1 • Stretches the graph if 0 < c < 1
You Do • Graph the function f(x) = 2(x-3) +2 • Where is the horizontal asymptote? y = 2
You Do, Part Deux • Graph the function f(x) = 4(x+5) - 3 • Where is the horizontal asymptote? y = - 3
The Number e • The number e is known as Euler’s number. Leonard Euler (1700’s) discovered it’s importance. • The number e has physical meaning. It occurs naturally in any situation where a quantity increases at a rate proportional to its value, such as a bank account producing interest, or a population increasing as its members reproduce.
The Number e - Definition • An irrational number, symbolized by the letter e, appears as the base in many applied exponential functions. It models a variety of situations in which a quantity grows or decays continuously: money, drugs in the body, probabilities, population studies, atmospheric pressure, optics, and even spreading rumors! • The number e is defined as the value that approaches as n gets larger and larger.
The Number e - Definition The table shows the values of as n gets increasingly large. As , the approximate value of e (to 9 decimal places) is ≈ 2.718281827
The Number e - Definition • For our purposes, we will use e ≈ 2.718. • e is 2nd function on the division key on your calculator. y = e
The Number e - Definition • Since 2 < e < 3, the graph of y = ex is between the graphs of y = 2x and y = 3x • ex is the 2nd function on the ln key on your calculator y = ex y = 3x y = 2x y =e
Natural Base • The irrational number e, is called the natural base. • The function f(x) = ex is called the natural exponential function.
Compound Interest • The formula for compound interest: Where n is the number of times per year interest is being compounded and r is the annual rate.
Compound Interest - Example • Which plan yields the most interest? • Plan A: A $1.00 investment with a 7.5% annual rate compounded monthly for 4 years • Plan B: A $1.00 investment with a 7.2% annual rate compounded daily for 4 years • A: • B: $1.35 $1.34
Interest Compounded Continuously • If interest is compounded “all the time” (MUST use the word continuously), we use the formula where P is the initial principle (initial amount)
If you invest $1.00 at a 7% annual rate that is compounded continuously, how much will you have in 4 years? • You will have a whopping $1.32 in 4 years!
You Do • You decide to invest $8000 for 6 years and have a choice between 2 accounts. The first pays 7% per year, compounded monthly. The second pays 6.85% per year, compounded continuously. Which is the better investment?
You Do Answer • 1st Plan: • 2nd Plan: