Seeram Chapter 11: Image Quality
CT. Seeram Chapter 11: Image Quality. CT Image Quality Parameters. Spatial Resolution. Contrast Resolution. Image Noise. Artifacts. Factors Influencing CT Image Quality. Beam Characteristics. Subject Transmissivity. Dose. Slice Thickness. Scatter. Display Resolution.


Seeram Chapter 11: Image Quality
E N D
Presentation Transcript
CT Seeram Chapter 11: Image Quality
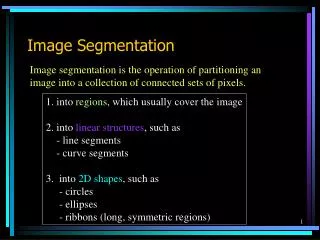
CT Image Quality Parameters Spatial Resolution Contrast Resolution Image Noise Artifacts
Factors InfluencingCT Image Quality Beam Characteristics Subject Transmissivity Dose Slice Thickness Scatter Display Resolution Reconstruction Algorithm
Spatial Resolution • Quantifies image blurring • “Ability to discriminate objects of varying density a small distance apart against a uniform background” • Minimum separation required between two high contrast objects for them to be resolved as two objects
Resolvable Object Size &Limiting Resolution • Smallest resolvable high contrast object • Often expressed as line pairs / cm • “Pair” is one object + one space One Pair
Resolvable Object Size:Limiting Resolution • Smallest resolvable high contrast object is half the reciprocal of spatial frequency • Example: • Limited resolution = 15 line pairs per cm • Pair is 1/15th cm • Object is half of pair • 1/15th / 2 • 1/30th cm • .033 cm • 0.33 mm 1/15th cm 1/30th cm
Geometric Factors affectingSpatial Resolution • Focal spot size • detector aperture width • slice thickness or collimation • Less variation likely for thinner slices • attenuation variations within a voxel are averaged • partial volume effect
Geometric Factors affectingSpatial Resolution Finite focalspot size focal spot - detector distance focal spot - isocenter distance
Geometric Unsharpness & CT Focal Spot • Decreased spatial resolution if object blurred over several detectors • Detector aperture size • must be < object for object to be resolved Small Object to be Imaged Detectors
Non-geometric Factorsaffecting Spatial Resolution • # of projections • Display matrix size • 512 X 512 pixels standard • Reconstruction algorithms • smoothing or enhancing of edges
Reconstruction Algorithm &Spatial Resolution • Back projecting blurs image • Algorithms may be anatomically specific • Special algorithms • edge enhancement • noise reduction • smoothing • soft tissue or bone emphasis
Hi-Resolution CT Technique • Very small slice thicknesses • 1-2 mm • High spatial frequency algorithms • increases resolution • increases noise • Noise can be offset by using higher doses • Optimized window / level settings • Small field of view (FOV) • Known as “targeting”
Contrast Resolution • Ability of an imaging system to demonstrate small changes in tissue contrast • The difference in contrast necessary to resolve 2 large areas in image as separate structures
CT Contrast Resolution • Significantly better than radiography • CT can demonstrate very small differences in density and atomic # This’ll be on your test. I guarantee it. Contrast Resolution Radiography10% CT<1%
CT Contrast Resolution Depends Upon • reconstruction algorithm • low spatial frequency algorithm smooths image • Loss of spatial resolution • Reduces noise • enhances perceptibility of low contrast lesions • image display
CT Contrast Resolution Contrast depends on noise Noise depends on # photons detected # photons detected depends on …
# of Photons Detected Depends Upon • photon flux (x-ray technique) • slice thickness • patient size • Detector efficiency • Note: • Good contrast resolution requires that detector sensitivity be capable of discriminating small differences in intensity
Small Contrast Difference Harder to Identify in Presence of Noise
CT Image Noise • Fluctuation of CT #’s in an image of uniform material (water) • Usually described as standard deviation of pixel values
CT Image Noise S(xi - xmean)2 Noise (s) = ------------------- (n-1) • Standard deviation of pixel values Xi = individual pixel value Xmean = average of all pixel values in ROI n =total # pixels in ROI
Noise Level • Units • CT numbers (HU’s)or • % contrast
Noise Measurement in CT • Scan water phantom • Select regions of interest (ROI) • Take mean & standard deviation in each region • Standard deviation measures noise in ROI
CT Noise Levels Depend Upon • matrix size (pixel size) • slice thickness • algorithm • electronic noise • scattered radiation • object size • Photon flux to detectors… • # detected photons • quantum noise
Photon Flux to Detectors • Tube output flux (intensity) depends upon • kVp • mAs • beam filtration • Flux is combination of beam quality & quantity • Flux to detectors modified by patient • Larger patient = less photons to detector
Slice Thickness • Thinner slices mean • less scatter • better contrast • less active detector area • less photons detected • More noise • To achieve equivalent noise with thinner slices, dose (technique factors) must be increased
Noise Levels in CT: • Increasing slice width = less noiseBUT • Increasing slice width degrades spatial resolution • less uniformity inside a larger pixel • partial volume effect
CT Image Quality inEquation Form s2(m) = kT/(td3R) Where s is variance resulting from noise k is a conversion factor (constant) T is transmissivity (inverse of attenuation) t is slice thickness d is pixel size R is dose
Noise Levels in CT: • When dose increases, noise decreases • dose increases # detected photons • Doubling spatial resolution (2X lp/mm) requires an 8X increase in dose for equivalent noise • Smaller voxels mean less radiation per voxel
CT Image Quality Trade-off s2(m) = kT/(td3R) To hold noise constant • If slice thickness goes down by 2 • Dose must go up by 2
Measurements of Image Quality • PSF = Point Spread Function • LSF = Line Spread Function • CTF = Contrast Transfer Function • MTF = Modulation Traffic Function
Point Spread FunctionPSF • “Point” object imaged as circle due to blurring • Causes • finite focal spot size • finite detector size • finite matrix size • Finite separation between object and detector • Ideally zero • Finite distance to focal spot • Ideally infinite
Quantifying Blurring Intensity ? • Object point becomes image circle • Difficult to quantify total image circle size • difficult to identify beginning & end of object
Quantifying BlurringFull Width at Half Maximum (FWHM) • width of point spread function at half its maximum value • Maximum value easy to identify • Half maximum value easy to identify • Easy to quantify width at half maximum Maximum HalfMaximum FWHM
Line Spread FunctionLSF • Line object image blurred • Image width larger than object width Intensity ?
Contrast Response FunctionCTF or CRF • Measures contrast response of imaging system as function of spatial frequency Lower Frequency Higher Frequency Loss of contrast between light and dark areas as bars & spaces get narrower. Bars & spaces blur into one another.
Contrast Response FunctionCTF or CRF • Blurring causes loss of contrast • darks get lighter • lights get darker Lower Frequency Higher Frequency Higher Contrast Lower Contrast
CT Phantoms • Measure • noise • spatial resolution • contrast resolution • slice thickness • dose • Available from • CT manufacturer • private phantom manufacturers • American Association of Physicists in Medicine • AAPM
CT Spatial vs. Contrast Resolution • Spatial & contrast resolution interact • High contrast objects are easier to resolve • Omprove one at the expense of the other • Can only improve both by increasing dose Increasing object size Increasing contrast
Contrast & Detail • Larger objects easy to see even at low contrast Increasing object size Increasing contrast
Contrast & Detail • Small objects only visible at high contrast Increasing object size Increasing contrast
Contrast – Detail Relationship • Contrast vs. object diameter • less contrast means object must be larger to resolve Visibility Increasing object size Difference in CT # Object Diameter Increasing contrast
Modulation Transfer FunctionMTF • Fraction of contrast reproduced as a function of frequency Freq. = line pairs / cm 1 MTF 50% Recorded Contrast(reduced by blur) Contrast provided to film 0 frequency
MTF • Can be derived from • point spread function • line spread function • MTF = 1 means • all contrast reproduced at this frequency • MTF = 0 means • no contrast reproduced at this frequency
MTF • If MTF = 1 • all contrast reproduced at this frequency Contrast provided to film Recorded Contrast
MTF • If MTF = 0.5 • half of contrast reproduced at this frequency Contrast provided to film Recorded Contrast
MTF • If MTF = 0 • no contrast reproduced at this frequency Contrast provided to film Recorded Contrast
CT Number • Calculated from reconstructed pixel attenuation coefficient (mt - mW) CT # = 1000 X ------------ mW Where: ut = linear attenuation coefficient for tissue in pixel uW = linear attenuation coefficient for water