Image Segmentation
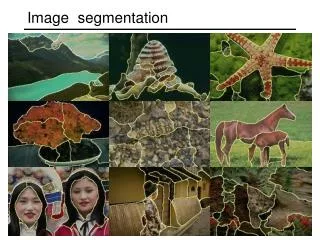
Image Segmentation. Image segmentation is the operation of partitioning an image into a collection of connected sets of pixels. 1. into regions , which usually cover the image 2. into linear structures , such as - line segments - curve segments 3. into 2D shapes , such as
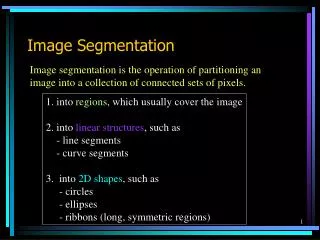

Image Segmentation
E N D
Presentation Transcript
Image Segmentation Image segmentation is the operation of partitioning an image into a collection of connected sets of pixels. 1. into regions, which usually cover the image 2. into linear structures, such as - line segments - curve segments 3. into 2D shapes, such as - circles - ellipses - ribbons (long, symmetric regions)
Goals of segmentation CSE 803 Fall 2008 Stockman
Region Segmentation:Segmentation Criteria From Pavlidis A segmentation is a partition of an image I into a set of regions S satisfying: 1. Si = S Partition covers the whole image. 2. Si Sj = , i jNo regions intersect. 3. Si, P(Si) = true Homogeneity predicate is satisfied by each region. 4. P(Si Sj) = false,Union of adjacent regions i j, Si adjacent Sjdoes not satisfy it.
So All we have to do is to define and implement the similarity predicate P. But, what do we want to be similar in each region? Is there any property that will cause the regions to be meaningful objects?
Main Methods of Region Segmentation • 1. Region Growing • 2. Split and Merge • 3. Clustering
Region Growing Region growing techniques start with one pixel of a potential region and try to growit by adding adjacent pixels till the pixels being compared are too disimilar. • The first pixel selected can be just the first unlabeled • pixel in the image or a set of seed pixels can be chosen • from the image. • Usually a statistical test is used to decide which pixels • can be added to a region.
The RGGROW Algorithm • Let Rbe the N pixel region so far and P be a neighboring • pixel with gray tone y. • Define the mean X and scatter S (sample variance) by • X = 1/N I(r,c) • S = 1/N (I(r,c) - X) 2 (r,c) R 2 2 (r,c) R
The RGGROW Statistical Test The T statistic is defined by (N-1) * N T = -------------- (y - X) / S (N+1) 1/2 2 2
Decision and Update • For the T distribution, statistical tables give us the • probability Pr(T t) for a given degrees of freedom • and a confidence level. From this, pick suitable • threshold t. • If the computed T t for desired confidence level, • add y to region R and update X and S . • If T is too high, the value y is not likely to have arisen • from the population of pixels in R. Start a new region. 2
RGGROW Example image Not so great and it’s order dependent. segmentation
Split and Merge 1.Start with the whole image 2. If the variance is too high, break into quadrants • Merge any adjacent regions that are similar enough. • Repeat Steps 2 and 3, iteratively till no more splitting or merging occur Idea: Good Results: Blocky
Clustering • There are K clusters C1,…, CK with means m1,…, mK. • The least-squares error is defined as • Out of all possible partitions into K clusters, • choose the one that minimizes D. K 2 D = || xi - mk || . k=1 xi Ck Why don’t we just do this? If we could, would we get meaningful objects?
Some Clustering Methods • K-means Clustering and Variants • Histogram-Based Clustering and Recursive Variant • Graph-Theoretic Clustering • EM Clustering
K-Means Clustering (review) Form K-means clusters from a set of n-dimensional vectors 1. Set ic (iteration count) to 1 2. Choose randomly a set of K means m1(1), …, mK(1). 3. For each vector xi, compute D(xi,mk(ic)), k=1,…K and assign xi to the cluster Cj with nearest mean. 4. Increment ic by 1, update the means to get m1(ic),…,mK(ic). 5. Repeat steps 3 and 4 until Ck(ic) = Ck(ic+1) for all k.
K-means Variants • Different ways to initialize the means • Different stopping criteria • Dynamic methods for determining the right number of clusters (K) for a given image • Isodata: K-means with split and merge
Histogram thresholding • Seek for the modes of multimodal histogram • Use knowledge directed thresholding
Otsu’s method assumes K=2. It searches for the threshold t that optimizes the intra class variance. CSE 803 Fall 2008 Stockman
Ohlander’s Recursive Histogram-Based Clustering • Input: color images of real indoor and outdoor scenes • starts with the whole image and finds the histogram • selects the R, G, or B histogram with largest peak • and finds the connected regions from that peak • converts to regions on the image and creates masks for each region and recomputes the histogram for each region • pushes each mask onto a stack for further clustering
Ohta suggested using (R+G+B)/3, (R-B)/2 and (2G-R-B)/4 instead of (R, G, B). Ohlander’s Method separate R, G, B tree2 tree1 sky
Jianbo Shi’s Graph-Partitioning • An image is represented by a graph whose nodes • are pixels or small groups of pixels. • The goal is to partition the vertices into disjoint sets so • that the similarity within each set is high and • across different sets is low.
Minimal Cuts • Let G = (V,E) be a graph. Each edge (u,v) has a weight w(u,v) • that represents the similarity between u and v. • Graph G can be broken into 2 disjoint graphs with node sets • A and B by removing edges that connect these sets. • Let cut(A,B) = w(u,v). • One way to segment G is to find the minimal cut. uA, vB
Cut(A,B) cut(A,B) = w(u,v). uA, vB B A w1 w2
Normalized Cut Minimal cut favors cutting off small node groups, so Shi proposed the normalized cut. cut(A, B) cut(A,B) Ncut(A,B) = ------------- + ------------- asso(A,V) asso(B,V) normalized cut asso(A,V) = w(u,t) uA, tV Association: How much is A connected to the graph V as a whole.
Example Normalized Cut B A 2 2 2 2 2 2 2 2 4 3 2 1 1 2 2 3 3 3 Ncut(A,B) = ------- + ------ 21 16
Shi turned graph cuts into aneigenvector/eigenvalue problem. • Set up a weighted graph G=(V,E) • V is the set of (N) pixels • E is a set of weighted edges (weight wij gives the similarity between nodes i and j)
Define two matrices: D and W • Length N vector d: di is the sum of the weights from node i to all other nodes • N x N matrix D: D is a diagonal matrix with d on its diagonal • Similarity matrix W: N x N symmetric matrix W: Wij = wij
Let x be a characteristic vector of a set A of nodes • xi = 1 if node i is in a set A • xi = -1 otherwise • Let y be a continuous approximation to x
Solve the system of equations (D – W) y = D y for the eigenvectors y and eigenvalues • Use the eigenvector y with second smallest eigenvalue to bipartition the graph (y => x => A) • If further subdivision is merited, repeat recursively
How Shi used the procedure Shi defined the edge weights w(i,j) by w(i,j) = e * ||X(i)-X(j)||2 / X e if ||X(i)-X(j)||2 < r 0 otherwise ||F(i)-F(j)||2 / I where X(i) is the spatial location of node i F(i) is the feature vector for node I which can be intensity, color, texture, motion… The formula is set up so that w(i,j) is 0 for nodes that are too far apart.
Examples of Shi Clustering See Shi’s Web Page http://www-2.cs.cmu.edu/~jshi
Representation of regions CSE 803 Fall 2008 Stockman