Download
1 / 18
180 likes | 221 Vues
Explore the concepts of operating and financial leverage, breakeven analysis, and the impact on business risk in this comprehensive guide. Learn how leverage affects earnings per share and the importance of managing business and financial risks effectively.

E N D
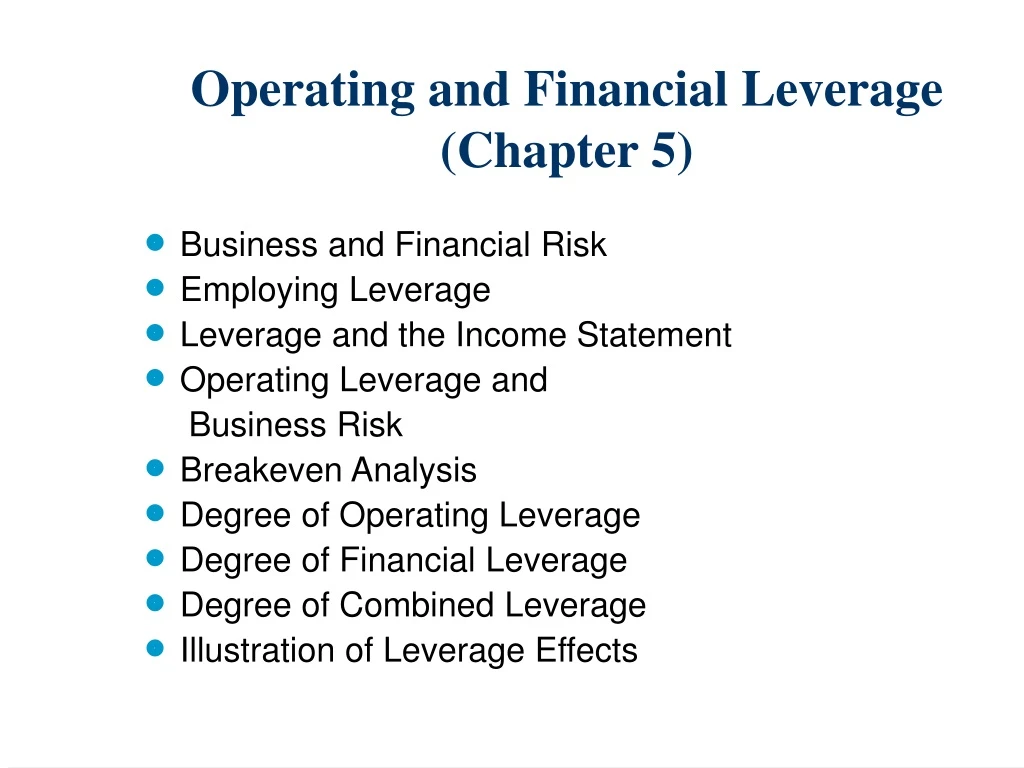
Operating and Financial Leverage(Chapter 5) • Business and Financial Risk • Employing Leverage • Leverage and the Income Statement • Operating Leverage and Business Risk • Breakeven Analysis • Degree of Operating Leverage • Degree of Financial Leverage • Degree of Combined Leverage • Illustration of Leverage Effects
Business and Financial Risk • Business Risk - Uncertainty inherent in the firm’s operations if it used no debt. • Major Factors Affecting Business Risk: • Total sales variability • Total fixed operating expenses • Financial Risk – Additional risk incurred through the use of debt financing.
Employing Leverage • Leverage: • Use of “fixed cost” items in the process of magnifying earnings. • Operating Leverage: • Use of “fixed operating costs” in the process of magnifying operating income (EBIT) • Financial Leverage: • Use of “fixed financial costs” (e.g., debt and preferred stock financing) in the process of magnifying earnings per share EPS. Our discussion focuses on the use of debt financing.
Leverage and the Income Statement Operating Leverage Sales - Fixed costs - Variable costs EBIT - Interest EBT - Taxes EAT Note: EPS = EAT/(# shares) [assuming no pfd. stock] Total Leverage Financial Leverage
Leverage Analysis: An ExampleWebb’s Incorporated Income Statement(Year Ended December 31, 2002) Sales (30,000 units @ $25) $ 750,000 - Variable costs ($7 per unit) (210,000) - Fixed costs (270,000) EBIT $ 270,000 - Interest expenses (170,000) EBT $ 100,000 - Taxes ( 34,000) EAT $ 66,000 Given 20,000 shares outstanding: EPS = $66,000/20,000 = $3.30
Key to Symbols Used in the Following Analyses Note: The symbols used in the notes differ somewhat from the symbols used in the text. • P = price per unit • Q = sales in units • V = variable cost per unit • F = fixed costs • VC = total variable costs • TC = F + VC = total costs • S = PQ = sales dollars • EBIT = S - TC
Operating Leverage and Business Risk • Calculating Breakeven Point in Units: • (1) S - TC = 0 • (2) S - F - VC = 0 • (3) PQ - F - VQ = 0 • (4) PQ - VQ = F Webb’s Breakeven Point in Units:
Breakeven Chart Thousands of Dollars S TC Thousands of Units
EBIT Chart Thousands of Dollars EBIT Thousands of Units
Degree of Operating Leverage • Note: If F = 0, DOL = 1 (i.e., without any F, the % change in EBIT would be equal to the % change in sales). By employing F, the firm’s % change in EBIT will be greater than the % change in sales.
Webb’s DOL When Q = 30,000 Units For every 1% change in sales, EBIT will change 2%. • Operating Leverage is Risky: If sales increase 5%, a DOL of 2.0 indicates that EBIT would increase 10%. On the other hand, if sales decline 7%, a DOL of 2.0 indicates that EBIT would decline 14%.
Degree of Financial Leverage • Note: If interest expense = 0, DFL = 1.0 (i.e., without any debt financing, the % change in EPS would be equal to the % change in EBIT). By incurring interest expense (debt financing) the firm’s % change in EPS will be greater than the % change in EBIT.
Webb’s DFL When Q = 30,000 Units For every 1% change in EBIT, EPS will change 2.7% Financial Leverage is Risky: If EBIT increases 2%, a DFL of 2.7 indicates that EPS would increase 5.4%. On the other hand, if EBIT declines 4%, a DFL of 2.7 indicates that EPS would decline 10.8%.
Degree of Combined Leverage • Note: If F = 0, and I = 0, DCL = 1.0 (i.e., without F or I the % change in EPS would be equal to the % change in sales). By employing F or I (or both), the firm’s % change in EPS will be greater than the % change in sales.
Illustration of Leverage Effects(A 10% Increase in Sales for Webb’s Inc.) Bef. Sales Inc. Sales (33,000 units @ $25) $ 825,000 $ 750,000 - Variable costs ($7 per unit) (231,000) (210,000) - Fixed costs (270,000) (270,000) EBIT $ 324,000 $ 270,000 - Interest expense (170,000) (170,000) EBT $ 154,000 $ 100,000 - Taxes ( 52,360) (34,000) EAT $ 101,640 $ 66,000 EPS = $101,640/20,000 = $5.08 EPS = $3.30