Exploring Predictive Model Interpretation: Trees and Plots
Learn to interpret single decision trees and boosting trees through relative importance and partial dependence plots with examples and illustrations for better model understanding.

Exploring Predictive Model Interpretation: Trees and Plots
E N D
Presentation Transcript
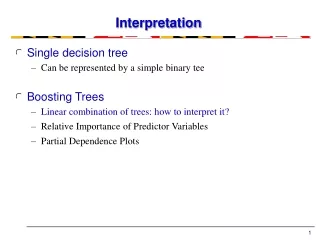
Interpretation • Single decision tree • Can be represented by a simple binary tee • Boosting Trees • Linear combination of trees: how to interpret it? • Relative Importance of Predictor Variables • Partial Dependence Plots
Single decision tree Measure of relevance for each predictor variable Xl Here, Xv(t) is used to partition the region Additive tree expansions More reliable due to the averaging Relative Importance of Predictor Variables
Interpretation by Partial Dependence Plots • Goal of Interpretation • Display the dependence of the approximation f(X) on the joint values of the input variables • What can we do already? • Identify most relevant variables by computing relative importance • Display functions of one or two arguments • How to display functions of higher dimensional arguments? • A collection of partial dependence plots • Partial dependence plot • shows the partial dependence of f(X) on 1 or 2 input variables (highly relevant, likely to be informative)
Partial Dependence Plots • Definition of partial dependence: • Analysis • Represent the effect of Xs on f(X) after accounting for the (average) effects of the other variables Xc on f(X) • They are not the effect of Xs on f(X) ignoring the effects of Xc
Illustration --- An Example of MART with Shrinkage • Experiment settings • J = 6 terminal nodes • Learning rate: v = 0.1 • Data set: California Housing • Response Variable: Median house value • Eight Predictor Variables: • median Income (MedInc), housing density (Population), average occupancy (AveOccup), location (Longitude and Latitude), average number of rooms (AveRooms) and bedrooms (AveBedrms), age of the house(HouseAge) • Results • Training and test error • Relative importance and partial dependence plots