Download
1 / 9
90 likes | 210 Vues
This document discusses strategies to improve US healthcare through targeted payment incentives. The primary objectives include achieving better health outcomes, enhancing care delivery, and reducing costs. Key insights emphasize that a small percentage of the population incurs the majority of healthcare costs, highlighting the importance of utilization rates over local price variations. The proposal includes reforms to Medicare payments, focusing on outcomes-based pricing and encouraging efficient resource use within hospitals. This approach aims to streamline healthcare expenditures while maintaining quality of care.

E N D
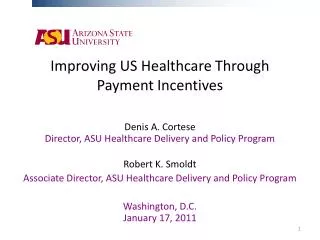
Improving US Healthcare Through Payment Incentives Denis A. CorteseDirector, ASU Healthcare Delivery and Policy Program Robert K. Smoldt Associate Director, ASU Healthcare Delivery and Policy Program Washington, D.C.January 17, 2011
Objective for US Healthcare: • Better Health • Better Care Delivery • Lower Cost • Value = Patient Outcomes + Safety + Service/Cost over time
Two Key Points on Cost: • 20% of Population = 80% of cost • Total Cost = Price per unit of service x Use Rate Use Rate
Use rate is the key • "… utilization - not local price differences - drives Medicare regional payment variation…" * • “Most of this variation (Medicare spending) was not due to differences in the price of care in different parts of the country, but rather to differences in the volume…." ** • There is a two fold difference between the MSA with greatest service use (Miami, FL) and the MSA with the least service use (Lacrosse, WI).” (After adjusting for regional prices, added payments for GME, IME, etc., demographics and beneficiary health statues)*** *"Prices Don't Drive Regional Medicare Spending Variations” Gottlieb, Zhou, Song, Gillman Andrews, Skinner and Sutherland ; Health Affairs, March 2010, vol 29. no 3, pp 537 -543 ** "Tracking the Care of Patients with Severe Chronic Illnesses” Wennberg, Fisher, Goodman, and Skinner; The Dartmouth Atlas of Health Care 2008 *** MedPac Report to Congress, January 2011, “Regional variation in Medicare services use.”
The Medicare Price Control Cycle Reduce line item payment rate to providers
Where to start given the two key points: • Expensive Patients – (those hospitalized) • Expanded DRG lump sum payments (to encourage judicious use rates) • Expanded DRGs = Present DRG + longer time than hospitalization + include physician services • Announce plan, give providers two years to self organize • Start with Medicare's most expensive DRG and go DRG by DRG • Providers define outcomes
Third Key Point – How to set the payment amount • Not formulas • Reality based pricing concept (Dr. Hal Luft*) • Cost of resources used by medical centers getting best risk adjusted outcomes + 3% * Luft, H., “Total Cure,” Harvard University Press, 2008, Pages 94-95
Hypothetical Example of EDRG payment amount based on concepts suggested by Dr. Hal Luft* Experience of teaching hospitals for EDRGx 1.8 Proposed pricing point 1.6 Top 1/3 of hospitals on outcomes 1.4 1.2 Outcomes for EDRG “x” 1.0 0.8 0.6 Median cost of top 1/3 of hospitals on outcomes Median Cost all teaching hospitals 0.4 0 10 20 30 40 50 60 *Luft, H., “Total Care,” Harvard University Press. 2008 Cost for EDRG “x” ($000s)