Who Has Better Scores?
210 likes | 386 Vues
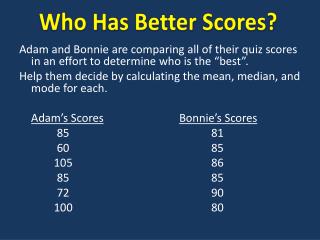
Who Has Better Scores?. Adam and Bonnie are comparing all of their quiz scores in an effort to determine who is the “best”. Help them decide by calculating the mean, median, and mode for each. Adam’s Scores Bonnie’s Scores 85 81 60 85 105 86 85 85

Who Has Better Scores?
E N D
Presentation Transcript
Who Has Better Scores? Adam and Bonnie are comparing all of their quiz scores in an effort to determine who is the “best”. Help them decide by calculating the mean, median, and mode for each. Adam’s ScoresBonnie’s Scores 85 81 60 85 105 86 85 85 72 90 100 80
The Winner? So, who has the better quiz scores?
Another Way to Compare What else do you think we could use from the data to compare the two data sets? Sometimes the measures of central tendency(mean, median, mode) aren’t enough to adequately describe the data. We also need to take into account the consistency, or spread, of the data.
Adam’s Scores 60 60 70 70 80 80 90 90 100 100 Bonnie’s Scores
Chapter 3 Section 2: Measures of Variation
Measures of Variation Numbers that describe diversity or variability in the distribution.
If all the scores in a distribution were the same, we would say that there is no variability • Variability - provides a quantitative measure of the degree to which scores in a distribution are spread out or clustered together • Central tendency gives a limited view of scores - variability adds another dimension
First Measure of Variation: R= highest value – lowest value -Range is least Range
Find the range of the following numbers 12, 14, 17, 34, 19, 24, 29, 20, 19, 18 11, 14, 17, 22, 26, 33, 32, 14, 15, 17 Highest Value = 34 Lowest Value = 11 Range = 34 – 11 = 23
Interquartile Range Measures the spread of the middle 50% of an ordered data set.
5 Steps to Find Interquartile Range • Step1: Order the data set from smallest to largest. • Step 2:Find the median for the ordered set. Denote by Q2. • Step 3: Find the median for the first 50% of the ordered set. The median found in Step 2 is not included in this portion of the data. Denote by Q1.
5 Steps to Find Interquartile Range (continued) • Step 4: Find the median for the second 50% of the ordered set. The median found in Step 2 is not included in this portion of the data. Denote by Q3. • Step 5: The interquartile range is computed from the following
Interquartile Range The following depicts the idea of the interquartile range.
Example:The following scores for a statistics 10-point quiz were reported. What is the value of the interquartile range? 7 8 9 6 8 0 9 9 9 0 0 7 10 9 8 5 7 9
First, Put the numbers in Order 7 8 9 6 8 0 9 9 9 0 0 7 10 9 8 5 7 9 In order: • 0 0 0 5 6 7 7 7 8 8 • 8 9 9 9 9 9 9 10
How many numbers are in the set? • 0 0 0 5 6 7 7 7 8 8 • 8 9 9 9 9 9 9 10 n = 18 Median= (n + 1)/ 2 = (18 + 1)/2 = 19/2 = 9.5 place
Median is between 9th & 10th Number • 0 0 0 5 6 7 7 7 8 8 8 9 9 9 9 9 9 10 9th 10th Median = (8 + 8)/2 = 8 Denoted: Q2 Q2 = 8
Find Q1 Q1 = 6 • 0 0 0 5 6 7 7 7 8 8 8 9 9 9 9 9 9 10 n = 9, Median = (n+1)/2 (10)/2 = 5th Place Find the median of the first half of the numbers and denote as Q1
Find Q3 Q3 = 9 • 0 0 0 5 6 7 7 7 8 8 8 9 9 9 9 9 9 10 n = 9, Median = (n+1)/2 (10)/2 = 5th Place Find the median of the 2nd half of the numbers and denote as Q3
Interquartile Range IQR = Q3 – Q1 = 9 - 6
Boxplot A graph of a data set obtained by drawing a horizontal line from the minimum value to Q1, drawing a horizontal line from Q3 to the maximum data value, and drawing a box whose vertical sides pass through Q1 and Q3 with a vertical line inside the box passing through the median, or Q2