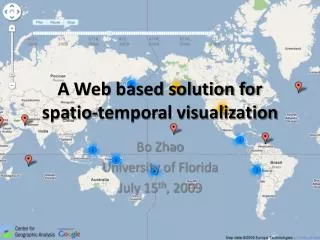
Web-Based Visualization System for Comprehensive Watershed Management in the Occoquan Basin
This project presents a web-based visualization and analysis system designed to manage watershed data in the Occoquan Basin. The system builds a comprehensive database of water information, including surface and groundwater data, and assesses water quality impacts from extreme weather events like flooding and drought. Key features include real-time data collection from monitoring stations, efficient data operation, online information publication, and automatic database synchronization. Future work aims to enhance visualization techniques and employ data mining methods for better pattern detection and analysis.

Web-Based Visualization System for Comprehensive Watershed Management in the Occoquan Basin
E N D
Presentation Transcript
A Web-based Visualization and Analysis System for Watershed Management Yufeng Kou, Chang-Tien Lu Dept. of Computer Science Virginia Tech Thomas Grizzard, Adil Godrej, Harold PostDept. of Civil EngineeringVirginia Tech
Outline • Introduction • System Architecture • System Demonstration • Future Work • Summarization
Introduction:Objective of the system • Build a comprehensive database of water information in the Occoquan Basin • Surface water, Ground water, Water quality • Report impact of extreme weather incidents on Occoquan water system • Flooding, draught, storm
Objective of the system • Water quality surveillance and evaluation • Chemical pollutant density • High efficiency data operation and dissemination • Real time data collection • Internet-based online information publication
Outline • Introduction • System Architecture • System Demonstration • Future Work • Summarization
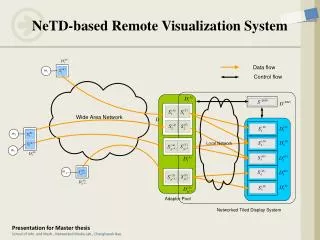
Hardware Architecture • Real-time Data collecting System • Connect monitoring stations to central database via telephone line • Data collecting: every 15 minutes • Web-based Information Publication • Maintain duplicate databases: • Master database: collect data from monitoring stations • Slave database: A copy of master database • Web server
Software Architecture • Standard 3-tier System • Thin client • All the computation and maintenance are on server side • High performance • Efficient for data centric tasks
Software Architecture • Automatic Data Synchronization • Master database Slave database • By a FTP client programmed with Java • Transfer action is triggered periodically by “Scheduled Task” in Windows 2003 • Only the increment of data is transmitted • Set firewall to ensure security
Software Architecture • Database system • Visual Foxpro 7.0 • Water data database: flow, stage, … • Station database: location, description, … • User database: name, password, contact information, … • Development Tools • ASP, HTML, Javascript • Java Applet, Java Servlet, Javascript
Outline • Introduction • System Architecture • System Demonstration • Future Work • Summarization
System Demonstration:Data comparison between stations • ST60: • Located upstream of Bull Run • Peak flow detected at 7AM, Jan 14, 2004 • ST45: • Located downstream of Bull Run • Peak flow detected at 5AM, Jan 14, 2004 • 9 Hour gap • Useful for flood prediction
System Demonstration:Linear scale vs Log scale • Linear Scale: • Suitable for data with small variance • Details lost when plotting data with large variance • Log Scale: • Suitable for data with large variance • Details retained for the value between the maximum and the minimum • Not good for data with small variance
System Demonstration:Statistics from historical data • 50 year flow data • Minimum flow • Maximum flow • Average flow • Help find interesting patterns • 1980 is a dry year • 1973 is a rainy year
System Demonstration:Data Cube • Data Cube • Generate the union of a set of alpha-numeric summary tables corresponding to a given hierarchy • Provide an aggregation view for different dimensions • Usually aggregate temporal property to different granularities • Or aggregate temporal dimension with spatial dimension
Data Cube:Stations vs Day of Month • Water flow data for 7 stations in April, May, and June 2004 • Show the flow fluctuation of multiple stations in a single figure • High flow values are identified, for example • By ST01 on April 13th ,14th; • By ST01 and ST10 on May 8th and 9th • By ST01 and ST10 on June 18th and 19th
Data Cube:Time of Day vs Day of Month • Water flow data for ST70 in April, May, and June 2004 • Clearly show the flow fluctuation at a specific time on a specific day • High flow values are identified • 20PM-24PM, on April 12th; • 0-3AM and 19-24PM, on April 13th • 0AM-12AM, on April 14
Data Cube:Years vs Day of Year • Water 53 year flow data for ST70 • High flow values are identified • Near the 150th day of year
Outline • Introduction • System Architecture • System Demonstration • Future Work • Summarization
Future Work • More visualization methods • 3-D representation • Both spatial attribute and non-spatial attributes • Animation • Graphic tools for data comparison • Histogram, bar chart, pie chart, 2-D and 3-D colormap • Apply Data Mining Techniques • Frequent Pattern Detection • Discover the area flooded frequently in the past 30 years • Abnormal Pattern Detection • Find a week in which flow changes dramatically compared with flow in the immediate adjacent weeks
Future Work • Apply Data Mining Techniques • Similarity Search • Find two similar pollutant leak accidents according to their impacts on the Occoquan water quality • Association Rule Formulation • Explore the relationship among temperature, humidity, and stage fluctuation • Build a decision support system • Combine GIS, Meteorological, Transportation, Economics, and Water monitoring data • Generate a comprehensive model • Rule-based system, Neural network, or Decision Tree • Predict damage of the incoming calamity and provide corresponding decision support
Summarization • Propose a web-based visualization and analysis system • Has been successfully used for watershed management • Based on a 3-tier client/server architecture • Near real-time data collection and dissemination • Support multiple visualization methods • Table, figure, and data cube • Support download data as text file, PDF, or JPEG • Future direction • Add more visualization methods • Add data mining functionalities
Thank you ! Any comment is appreciated. ykou@cs.vt.edu