
Assessing Lower Canopy Vegetation for Site Quality and Wildlife Habitat in Forest Ecosystems
E N D
Presentation Transcript
Lower Canopy Information • Useful in Assessing Site Quality • Examining Structural Patterns • Wildlife-Habitat relationships • Biological Diversity quantification • Biomass of secondary forest “products” • Multiresource Inventory Component ESRM 304
Site Quality • Productive capacity of forest land • Useful for … • Determining what species are suitable • Predicting growth potential • Evaluating ecosystem resiliency • Determining management priorities • Land valuation
Site Quality Site Index for Ponderosa Pine, 100-yr basis
Site Quality Potential for forest growth can be identified by using assemblages of lower canopy vegetation Scots pine growing in Finland …
Closer to home … Site Quality
Examining Structural Patterns • Northwest ecosystems contain many different vegetation patterns • Types, amounts, and distribution of vegetation patterns define water quantity and quality, wildlife habitat, timber resources • Vegetation patterns impact forest processes such as streamflow, erosion, and succession • forest landscapes are created and maintained through a balance of disturbance and recovery processes.
Vagrant shrew Townsend’s mole Meadow voles Jumping mice Deer mouse Gophers Ground squirrels Chipmunks | | | | | | | | Marsh and Trowbridge’s shrews Southern red-backed vole Tree and flying squirrels Keen’s mouse Shrew-mole Coast mole Wildlife-HabitatRelationships
Biological Diversity Quantification • Indexes attempt to combine abundance, composition, dominance into single no. • Diversity at different scales • Landscape level • Community-Ecosystem level • Population-species level • Genetic level
Diversity at Different Scales • Community-ecosystem Level (e.g., Lower Canopy) • How have management activities or other natural disturbances affected species diversity? • What is the function of a species in the community? • Where are the areas of high species richness, endemism, or rarity and how well are they protected? • Community Metrics • Richness, composition, Shannon, Simpson
Lower Canopy Structure & Diversity • Horizontal structure / diversity • Species Richness • Number of species present, ni • Species Composition • pi = amt. of species i / amt. all spp. • Shannon Index (H’) • H’ = -∑pi . ln(pi) • Simpson’s Index (D) • D = ∑[ni(ni-1)] / [N(N-1)] usually expressed as 1/D
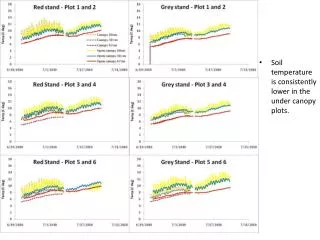
Lower Canopy Structure & Diversity • Vertical structure / diversity • BSD is directly related to FSD
Biomass of secondary forest products • Secondary Forest Products • Floral arrangements (salal, ferns) • Mushrooms • Fiddle heads (Ferns) • Others …
Biomass of secondary forest products Some Biomass Equation examples: Shrubs RUUR (trailing blackberry): TAB = –1.214 + 0.8392 (COV) VACCI (Vaccinium species): TAB = 0.0 + 1.644 (COV) Ferns ATFI (lady fern): TAB = 0.0 + 1.235 (COV) PTAQ (bracken fern): TAB = 0.0 + 3.1057 (COV)
Multiresource Inventory Component • The type of information needed for managing any land parcel includes a multitude of resource values. • Integrated multipurpose resource inventories, or multiresource inventories have been developed for this purpose • In general, we need to know the quantity, quality, and extent of the resources.
Multiresource inventories Relative priority for assessing each resource (Low, Med, High) depends on the inventory objectives:
Inventory Planning Checklist A comprehensive plan ensures all facets of the inventory are considered • data to be collected • financial support needed • logistical support required • compilation procedures
Inventory Planning Checklist Be sure to consider the following 1. Purpose of the inventory 2. Background information 3. Description of Area 4. Information required in final report
Inventory Planning Checklist 5. Sample survey design • Define target population • Define sample unit • Define required accuracy and precision • Will need to construct confidence interval • estimate ± “t-multiplier” x standard error of estimate • Decide how samples will be collected • Decide how many sample units will be measured • Know budgeting limitations for field work
Inventory Planning Checklist 6. Photo, satellite, other remotely sensed info. interpretation procedures 7. Fieldwork procedures 8. Compilation and calculation procedures 9. Final report 10. Maintenance
5. Sample survey design • Define target population • All Douglas-fir trees in a certain area with a DBH of at least 5.6” • Specify units of measure: “…metric tons of carbon of all Douglas-fir trees …” • Define sample unit • Fixed-area plots: 1/5, 1/10, 1/20, 1/40-acre sizes common for overstory trees; 1/100-acre, or less for seedling regeneration • Transects: common for understory and groundstory vegetation, LOD • Individuals: a deer, a hiker on a trail, a log • Groups: truckload of logs, herd of deer, group of hikers
5. Sample survey design • Define required accuracy and precision • Depends on survey objectives (and a bit on convention) • Multiresource surveys / Stewardship plans • Want est. of mean within 10 –20% of pop. mean w/ 70–90% C.I. • Land acquisition surveys / Timber sale survey • Want est. of mean within 5 –10% of pop. mean w/ 95% C.I. • Special surveys (timber trespass, regeneration, insect/disease) • Varies with application
5. Sample survey design • Decide how sample units will be selected • Simple Random Sampling (SRS) • Systematic sampling • Stratified random sampling • Two-phase sampling • Multistage sampling • Cluster sampling • Purposive sampling • Convenience sampling • Decide how many sample units will be measured • Know what equations will be used to compute estimates • Use of statistical formulas preferred
5. Sample survey design • For SRS infinite populations (or sampling with replacement) n = number of sample units required for desired precision E, with confidence level implied by z z = standard normal deviate (Z-table or table following) CV = coefficient of variation: std. dev. divided by mean as percent, for forest to be sampled: E = allowable error or desired accuracy (in percent) for the quantity of interest (e.g. biomass, volume, carbon, etc.) k = correction term to simplify computations
5. Sample survey design Confidence level z-value k 80% 1.282 1.31 90% 1.645 1.87 95% 1.960 2.44 99% 2.576 3.79
5. Sample survey design • For SRS in finite populations (or sampling without replacement) N = Total number of sampling units in population, all other symbols are as before
5. Sample survey design • Rules of thumb For ~ 1/10 acre plots in highly variable populations (having a CV of at least 50%): Area (acres) number of samples (n) Up to 10 ~ 10 11 – 40 ~ 1 per acre 41 – 80 20 + 0.5 (area in acres) 81 – 200 40 + 0.25(area in acres) 200 + Use sample size formulas
5. Sample survey design • Know budgeting limitations for field work • Simple cost model Ct = Co + n C1 where Ct = Total cost of survey Co = Overhead cost, including planning, organization, analysis, compilation, etc. C1 = Cost per sampling unit n = number of sampling units to be measured Number of sample units is then limited by: n = (Ct - Co) / C1
Summary Remarks • Multiresource surveys require careful planning to achieve desired goals with minimum amount of work • Difficult to achieve same accuracy / precision for every resource – priorities must be set according to survey goals • Consider all ten (10) planning steps in design • Know and carefully define target population, sampling frame, sampling units, decide how many samples to measure, know budgeting limitations
Summary Remarks • Diversity at different scales • Landscape • Community • Community – Lower Canopy Structure & Diversity • Horizontal / Vertical Structure • Population - Species • Genetic
Summary Remarks • Need info on structure, variability, processes for: • Grouping of stands into productivity classes • Building inventory on critical habitat conditions • I.D.-ing wildlife-habitat relationships • Enhancement of grouping stands into risk classes • Development of management targets for • Silvicultural manipulations • Managing potential fire hazard • Biological diversity maintenance