Download
1 / 42
420 likes | 628 Vues
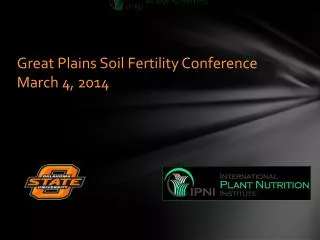
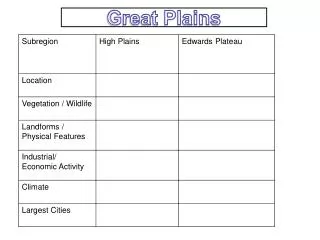
Great Plains Soil Fertility Conference March 4, 2014.

E N D
He was instrumental in developing practical site-specific nutrient management strategies in the western Great Plains. His vision and practical approaches have been important in its adoption by growers and ag-industry in Colorado and neighboring states • Dave Franzen, NDSU
“He was perceptive about cultural differences that were important for him to succeed …, and he always reached out to others. As a major adviser, I just had to point him in the general direction regarding projects, and then work hard to stay ahead of his resource needs! He is truly a credit to our profession, and I feel privileged and honored to know and work with him and his lovely wife, and to count them as friends. I look forward to the many important contributions to our science, and to a better world for others, that I know he will make in the future.” • Dr. Mark Alley, KOCH Ind.
Dr. Raj KhoslaMonfortProfessorAssistant Dean of Int. ProgramsColorado State University
OSU Hand Planter Dr. Edgar Ascencio (CARE, CENTA)
World Maize • 176,000,000 ha’s in 2012 (FAOstat) • 875,000,000 Mg, produced, 4.9 Mg/ha • 48,370,000 ha’s in the developing world • 60% planted by hand≈ 30,000,000 hectares or 12% of the total maize area in the world
Planter Action • The planter is pressed down and compresses the internal spring. • Singulation drum rotates and seed is released on the down stroke. • The planter is ‘relaxed’ and the spring returns it to the initial position.
seed size (2653-4344 seeds/kg)seed type, shape fertilizer 1,000,000 cycles 0.29g/seed 60,000 seeds/ha 3443 seeds/kg 1.0 kg hopper 17 times refill http://nue.okstate.edu/Hand_Planter.htm
Dr. Randy Taylor Dr. NyleWollenhaupt
Nov 13, 2013 SED = 8.6
Importance of Singulation • 0.76m Row Spacing • Heterogeneity in plant spacing, and plant stands reduce yields (1997, Nielsen, Purdue)
Thailand Mexico ZambiaEl Salvador Guatemala Regional Trials: El Salvador, Thailand, Colombia, Uganda, Zambia
Variables • Brush size, location, stiffness • Drum orientation • Drum cavity size • Drum angle • Internal Housing (1, 2, 3) (brush position) • Seed size, shape (range from 2652 to 4344 seeds/kg) • Operator (many)
Commercial Plans • Injection molding (various parts) • AGCOIndigdevNGO-model
Impact of Yield Level on Nitrogen Demand for Maize in the Midwest Oklahoma State University, Stillwater, OKbill.raun@okstate.edu (405 744 6418)
Long Term Trials Evaluated Arnall, D.B., A.P. Mallarino, M.D. Ruark, G.E. Varvel, J.B. Solie, M.L. Stone, J. L. Mullock, R.K. Taylor, and W.R. Raun. 2013. Relationship between grain crop yield potential and nitrogen response. Agron. J. 105:1335–1344
Literature, N Rates • Understanding that grain yield and N rate are not related is critical for N rate recommendations • Analyzed a total of 170site years of maize field experiments in the Central Great Plains. • Optimum N rate = (N uptake max yield - N uptake check plot)/NUE
Maize + sd 195 Avg. 136 - sd 77
Optimum N rates differed radically from one year to the next at all sites N rates temporally dependent and unpredictable within specific locations Fundamental theory has to right
Latitude “The human mind, when stretched by a new idea, can never shrink to its original size” Oliver Wendell Holmes
We cannot talk about agriculture without talking about the environment; we cannot talk about the environment with talking about agriculture; and we cannot talk about either without talking about the entire world. Dr. Bobby Stewart
By 2050 there will be 9.1 billion people. Increase of 30% Food production during the same period will have to increase 70% 95% of the increased population will be in the developing world
Agriculture and the Environment Food and Agricultural Organization, “Livestock's Long Shadow” surveys damage done by sheep, chickens, pigs and goats. But in almost every case, the world's 1.5 billion cattle are most to blame. Livestock are responsible for 18 per cent of the greenhouse gases that cause global warming, more than cars, planes and all other forms of transport put together. The Independent.co.uk
Soil Organic Carbon (Tillage) The percent increase in atmospheric CO2 due to a worldwide decrease of 3% in soil organic matter of arable land was estimated to be 20 mg kg-1 Decrease in soil organic matter accounted for 6 to 25% of the 80 mg kg-1 (340-260) increase in atmospheric CO2 over the last 150 years Mullen, R. W., et al. (1999) 'Estimated increase in atmospheric carbon dioxide due to worldwide decrease in soil organic matter', Communications in Soil Science and Plant Analysis, 30:1713-1719
Of the 7 billion people in the World, more than 1 billion live on less than $1 per day. More than 2.7 billion live on less than $2 per day. The World Bank has estimated that the number of people in developing countries with household incomes of $16,000 will increase from 352 million in 2000 to 2.1 billion by 2030. Where will these problems likely be solved?
U.S. 6.9% 3770 cal Ethiopia 57% 1950 cal Ireland 8.5% 3530 cal Bolivia 61% 2090 cal France 13.8% 3550 cal Angola 80% 1950 cal Italy 14.7% 3550 cal Twenty poorest countries spend more than 50% of income on food.
At the top of the food chain rankings, people in U.S. and Canada consume about 800 kg annually, mostly as meat, milk and eggs. At the bottom, India consumes about 200 kg consuming nearly all directly, leaving little for conversion to protein. The world average production of grain per person is about 350 kg per person compared to 285 in 1961. (Food and Agriculture Organization Statistics, Rome)
Bundy, Larry G., Todd W. Andraski, Matthew D. Ruark and Arthur E. Peterson. 2011. Long-termcontinuouscorn and nitrogenfertilizereffectsonproductivity and soilproperties. Agron. J. 103:1346-1351. Brezonik, P. L., Bierman Jr, V. J., Alexander, R., Anderson, J., Barko, J., Dortch, M., ... & Wiseman Jr, W. J. (1999). Effects of reducing nutrient loads to surface waters within the Mississippi River Basin and the Gulf of Mexico. National Oceanic and Atmospheric Administration National Ocean Service Coastal Ocean Program. Blevins, R. L., Cook, D., Phillips, S. H., & Phillips, R. E. (1971). Influence of no-tillage on soil moisture. Agronomy Journal, 63(4), 593-596. Bundy, L.G., and T.W. Andraski. 1995. Soil yield potential effects on performance of soil nitrate tests. J. Prod. Agric. 8:561–568 Cerrato, M.E., and A.M. Blackmer. 1990. Comparison of models for describing maize yield response to nitrogen fertilizer. Agron. J. 82:138–143. David, M. B., Gentry, L. E., Kovacic, D. A., & Smith, K. M. (1997). Nitrogen balance in and export from an agricultural watershed. J. Environ.Qual., 26(4), 1038-1048. Davis, D.M., P.H. Gowda, D. J. Mulla, and G.W. Randall. 2000. Modeling nitrate nitrogen leaching in response to nitrogen fertilizer rate and tile drain depth or spacing for southern Minnesota, USA. J. Env. Qual. 29:1568-1581. Derby, N. E., Steele, D. D., Terpstra, J., Knighton, R. E., & Casey, F. X. (2005). Interactions of nitrogen, weather, soil, and irrigation on maize yield. Agronomy journal, 97(5), 1342-1351. Fenster, W. E., C. J. Overdahl, Randall, G. W., & Schoper, R. P. (1978). Effect of Nitrogen Fertilizer on Maize Yield and Soil Nitrates (Vol. 153). Agricultural Experiment Station, University of Minnesota. Ismail, I., Blevins, R. L., & Frye, W. W. (1994). Long-term no-tillage effects on soil properties and continuous maize yields. Soil Science Society of America Journal, 58(1), 193-198 Jaynes, D. B., Colvin, T. S., Karlen, D. L., Cambardella, C. A., & Meek, D. W. (2001). Nitrate loss in subsurface drainage as affected by nitrogen fertilizer rate. J. Environ.Qual. 30(4), 1305-1314. Jokela, W. E., & Randall, G. W. (1989). Maize yield and residual soil nitrate as affected by time and rate of nitrogen application. Agronomy journal, 81(5), 720-726. Lory, J.A., and P.C. Scharf. 2003. Yield goal versus delta yield for predicting fertilizer nitrogen need in maize. Agron. J. 95:994-999. Mallarino, A.P., and E. Ortiz-Torres. 2006. A long-term look at crop rotation effects on maize yield and response to N fertilization. In: The Integrated Crop Management Conference Proceedings, Ames, IA. 29–30 Nov. 2006. Iowa State Univ. Ext., Ames. p. 209–213. Malzer, G.L., P.J. Copeland, J.G. Davis, J.A. Lamb, P.C. Robert, and T.W. Bruulsema. 1996. Spatial variability of profitability in site- specific N management. p. 967–975. In P.C. Robert et al. (ed.) Precision agriculture. Proc. Int. Conf., 3rd, Minneapolis, MN. 23–26 June 1996. ASA, CSSA, and SSSA, Madison, WI Mamo, M., Malzer, G. L., Mulla, D. J., Huggins, D. R., & Strock, J. (2003). Spatial and temporal variation in economically optimum nitrogen rate for maize. Agron. J. 95(4), 958-964. Onken, A.B., R.L. Matheson, and D.M. Nesmith. 1985. Fertilizer nitrogen and residual nitrate-nitrogen effects on irrigated maizeyield. Soil Sci. Soc. Am. J. 49:134–139. Randall, Gyles W., Jeffrey A. Vetsch, and Jerald R. Huffman. 2003. Maize production on a subsurface-drained mollisol as affected by time of nitrogen application and nitrapyrin. Agron. J. 95:1213-1219. Raun, W. R., J. B. Solie & Stone, M. L. (2011). Independence of yield potential and crop nitrogen response. Precision Agriculture, 12(4), 508-518 Scharf, P. C., Kitchen, N. R., Sudduth, K. A., Davis, J. G., Hubbard, V. C., & Lory, J. A. (2005).Field-scale variability in optimal nitrogen fertilizer rate for maize. Agron. J. 97(2), 452-461. Schlegel, A.J., and J.L. Havlin. 1995. Maize response to long-termnitrogen and phosphorus fertilization. J. Prod. Agric. 8:181–185. Varvel, G.E., W.W. Wilhelm, J.F. Shanahan, and J.S. Schepers. 2007. An algorithm for maize nitrogen recommendations using a chlorophyll meter based sufficiency index. Agron. J. 99:701-706. Vetsch, Jeffrey A., and Gyles W. Randall. 2004. Maize production as affected by nitrogen application timing and tillage. Agron. J. 96:502-509.
Grain production is vital because worldwide people get 48% of their calories from eating grain directly. As incomes rise, the percent drops dramatically as diets change to include more meat, milk, eggs and other foods that require more grain to produce. About 48% of grains are eaten directly, 35% fed to animals, and 17% for ethanol and other fuels. WorldwatchInstitute, August 12, 2011 worldwatch.org