Download
1 / 36
360 likes | 633 Vues
Module 7: Cost Behavior & Cost-Volume- Profit Analysis. ACG 2071 Created by: M. Mari Fall 2007-1. Cost-Volume-Profit Analysis (CVP). Which helps them predict how changes in costs and sales levels affect income

E N D
Module 7: Cost Behavior & Cost-Volume-Profit Analysis ACG 2071 Created by: M. Mari Fall 2007-1
Cost-Volume-Profit Analysis (CVP) • Which helps them predict how changes in costs and sales levels affect income • CVP analysis involves computing the sales level at which a company neither earns an income nor incurs a loss – break even point
Cost Behavior • refers to the manner in which a cost changes as a related activity changes. • Activity bases – activities that are thought to cause the cost to be incurred. • Relevant range – range of activity over which the changes in the cost that are of interest.
Cost Classifications • Three types • Variable Cost • Fixed Cost • Mixed Cost
Variable costs • costs that vary in proportion to changes in the level of activity. • Direct materials • Direct labor
Fixed Costs • costs that remain the same in total dollar amounts as the level of activity changes.
Mixed Costs • has characteristics of both a variable and a fixed cost. • Could behave as a fixed costs for part of the relevant range and then variable cost
Contribution Margin Concept • Contribution margin = Sales – Variable costs • Contribution margin ratio = Sales – Variable costs Sales • Is most useful when the increase or decrease in sales volume is measured in sales dollars • Unit contribution margin = Sales price per unit – Variable cost per unit
Example • The Company has sales of $1,000,000, variable costs of $800,000. The company sold 50,000 units. Compute the contribution margin and the contribution margin ratio. • Contribution margin = Sales – Variable cost • = $1,000,000 - $800,000 = $200,000 • Contribution margin ratio = (Sales – VC)/Sales • = (1,000,000 – 800,000)/1,000,000 • = 20% • Unit Contribution margin = Contribution margin • Units sold • = $200,000 • 50,000 • = $4
Break-even Analysis • to determine the units of sales necessary to achieve the break even pint in operations • to determine the units of sales necessary to achieve a target or desired profit
Break-Even Point • Is the level of operations at which a business’s revenues and expired costs are exactly equal? • A business will have neither an income nor a loss from operations.
Break Even Point Revenues Expenses
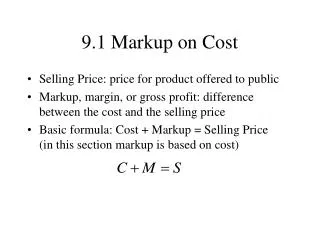
Break even formula • BEP = Fixed Costs__________ Unit contribution margin
Example • Suppose that selling price is $25, variable cost $15 and fixed costs are $90,000. What is break even point? BEP = Fixed costs / Unit Contribution Margin • = $90,000/ (25 – 15) = $90,000/$10 = 9,000 units • At sales level of 9,000 units will result in no gain or loss to the company. • Proof: • Sales: ($25 X 9,000) $225,000 • Variable cost: ($15 x 9,000) 135.000 • Contribution margin 90,000 • Fixed costs 90,000 • Operating income -0-
Changes in fixed costs • Example: Suppose that selling price is $25, variable cost $15 and fixed costs are $90,000. What is break even point if fixed costs increase to $100,000? BEP = Fixed costs/ Unit Contribution margin = $100,000/ (25-15) = 10,000 units Due to an increase in fixed costs from $90,000 to $100,000, break even point increased
Changes in variable costs • Example: Suppose that selling price is $25, variable cost $15 and fixed costs are $90,000. What is break even point if variable costs decrease to $10? • BEP = Fixed costs/ Unit Contribution margin • = $90,000/ (25-10) = 6,000 units • Due to a decrease in variable costs from $15 to $10, break even point decreased to 6,000 units from 9,000 units or a decrease of 3,000 units
Changes in selling price • Example: Suppose that selling price is $25, variable cost $15 and fixed costs are $90,000. What is break even point if selling price increase to $30? • BEP = Fixed costs/ Unit Contribution margin • = $90,000/ (30-15) = 6,000 units • Due to an increase in sales price from $25 to $30, break even point decreased to 6,000 units from 9,000 units or a decrease of 3,000 units.
Desired or Target Profit BEP = Fixed costs + Desired Profit Unit contribution margin Example: Suppose that selling price is $45, variable cost $30, and fixed costs are $60,000. The company wants a desired profit of $45,000. What is break even point? • BEP = Fixed costs + Desired profit/ Unit Contribution margin = ($60,000)/ (45-30) = 4,000 units • BEP = Fixed costs + Desired profit/ Unit Contribution margin = ($60,000 + $45,000)/ (45-30) = 7,000 units • To create $45,000 of profit, must sell 7,000 units or 3,000 more than break even point
Charts Costs Total cost Variable Fixed costs Units
Graphical – Break even point Sales $ Total costs Profit Break even point Sales = TC Loss Units 0
Sales Mix Consideration • More than one product is sold at varying selling prices • Products often have different unit variable costs • Products have different contribution margin • Sales volume necessary must a mix of both products
Example 6: • Cascade Co produces two products Yuk and Gunk. Yuk has a selling price of $90 per unit and variable cost of $70. Gunk has a selling price of $140 and variable cost of $95. Fixed costs are $200,000. Gunk’s sales are approximately 80% of total sales for the company. What is the break even point for the sales mix?
Example 6: BEP = Fixed Costs Sales mix CM = $200,000 $25 BEP = 8,000 units Of what products: YUK: 8,000 units * 80% = 6,400 units GUK: 8,000 units * 20% = 1,600 units
Example 7: • ABC Company has two products Y and X. Y has a selling price of $100 and variable costs of $60. It is 70% of total sales. X has a selling price of $50 and variable cost of $25. Fixed costs are $248,500. What is BEP?
Margin of Safety • Indicates possible decrease in sales that may occur before an operating loss occurs. Margin of Safety = Sales – Sales at BEP Sales
Margin of Safety • If sales are $400,000 and sales at break even are $300,000 what is margin of safety? • Ms = Sales – Sales BEP = $400 - $300 Sales $400 = 25%
Cost estimation techniques Steps 1. Find the highest and lowest level of production 2. Find the difference in total cost from highest to lowest level of production 3. Find the difference in total units from highest to lowest level of production 4. Variable cost per unit Difference in Total cost Difference in Total units 5. Find fixed cost by solving this equation Total cost = Fixed cost plus Variable cost High-Low Method
Example • Step 1: Find highest and lowest level of production. Step 2: Get the difference
Example continued Step 3: Compute Variable cost per unit • Variable cost = Difference in Total Cost Difference in Units =$20,250 1,350 = $15 per unit • Total cost = FC + VC • $61,500 = FC + ($15 *2,100 units) • $61,500 = FC + 31,500 • FC = $30,000
Example Cont’d • Step 4: Compute Fixed costs • Total cost = Fixed Costs + Variable Cost • using the data at 2,100 units of production, we solve for fixed costs $61,500 = FC + ($15 *2,100 units) $61,500 = FC + 31,500 FC = $30,000
Example Continued • Given the information in the prior slide, what is the total cost at 2,000 units of output? Total cost = Fixed costs + Variable costs Total cost = $30,000 + ($15 X 2,000) Total cost = $60,000
Example 2 What is the variable cost per unit and fixed cost?
Operating Leverage • The relative mix of a business’s variable costs and fixed costs is measured by the operating leverage • Since the difference between contribution margin and income from operations is fixed costs, companies with large amounts of fixed costs will generally have a high operating leverage. • Indicates that a small increase in sales will yield a large percentage increase in income from operations. • Low operating leverage • Indicates that a large increase in sales is necessary to significantly increase income from operations
Operating Leverage • Operating Leverage = Contribution Margin Income from operations