Download
1 / 38
380 likes | 664 Vues
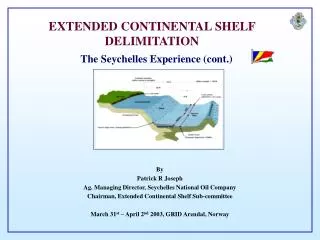
Nicholas C. Makris, Massachusetts Institute of Technology Purnima Ratilal, Northeastern University Deanelle Symonds, Massachusetts Institute of Technology Srinivasan Jagannathan, Massachusetts Institute of Technology Sunwoong Lee, Massachusetts Institute of Technology

E N D
Nicholas C. Makris, Massachusetts Institute of Technology Purnima Ratilal, Northeastern University Deanelle Symonds, Massachusetts Institute of Technology Srinivasan Jagannathan, Massachusetts Institute of Technology Sunwoong Lee, Massachusetts Institute of Technology Woody Nero, Naval Research Laboratory Fish Population and Behavior Revealed by Instantaneous Continental-Shelf-Scale Imaging
Echosounder section through the fish Coventional Fish-Finding Sonar Example MAE2003 Output Courtesy of NRL 0 m Average Ship Velocity: ~3 m/s R/V Henlopen 50 m Frequency: 38 kHz Beamwidth: 6.8o 100 m Approx. 2 km -20 -30 80 m -40 -50 Layer Strength (dB) -60 -70 -80 10 m
Measuring and Monitoring Fish Populations with Ocean Waveguide Remote Sensing (OAWRS)
Location of 2003 OAWRS Survey: Continental Shelf South of NY
The Geoclutter Program Remote Imaging in the Continental Shelf
OAWRS 2003 Survey US Research Ship (RV) Oceanus: OAWRS Receiver Ship Towed Receiver Array RV Endeavor: OAWRS Source Ship Moored Vertical Source Array CFFS Transect RV Henlopen: Conventional Fish Finding Sonar (CFFS) Survey Local Water Depth ~80-100m Fish Groupings
Geometric Spreading: Free space & waveguides No Geometric Spreading Loss in a 1-D Waveguide Spherical Spreading Loss in Free Space A A A A r1 1-D Waveguide: r2 Cylindrical Spreading Loss in a 2-D Waveguide ρ2 ρ1 Free Space (CFFS): H 2-D Waveguide (OAWRS) :
Source Receiver Instantaneous OAWRS Image of Areal Fish Population Density 70m 09:32 EDT 80m Consolidated Shoal Fish Bridges connecting population centers Northings from Source (km) A small fish group Continental Shelf Edge Population Centers Vacuoles within large shoal 100m Movie Box 800m 120m Eastings from Source (km)
Scup Dogfish Atlantic Mackerel Silver Hake (whiting) Atlantic Herring Black Sea Bass Red Hake Spotted Hake Fish Species Found in the Continental Shelf South of NY
Instantaneous Wide-Area Detection and Imaging of Fish Schools May 14: 09:32:25 EDT May 15: 08:49:55 EDT 70m 70m 80m 80m 100m 120m 100m 120mb 200m 400m
Spatial Fish Population Density Spectrum Large Shoal Present Scattered Fish Groups Spatial Fish Population Density Spectrum (fish/m2)2 / (1/m) Spectral density is proportional to fs-1.5 Spatial Frequency fs(1/m)
Spatial and Temporal Correlation: OAWRS vs CFFS 12:09:55 EDT 12:19:55 EDT 12:29:55 EDT 11:59:05 EDT -6 100m 100m 100m 100m -9 α Northings from Source (km) -12 β γ -15 δ A D C B -18 12 0 3 6 9 Eastings from Source (km) Echogram corresponding to CFFS line transect (11:54:39-12:39:01 EDT) α β γ δ
May 14: Fish Population, Area, and Coherence Area for various density thresholds -6 -9 -12 (km) -15 -18 0 3 6 9 12 Total Population (Millions) nA>0.2 nA<0.2 nA>1 nA<1 Consolidated Shoal Area (km2) Largest fraction 2nd largest fragment Consolidated Shoal Coherent Area (km2) Largest fraction 2nd largest fragment Eastern Daylight Time (Hours)
Time Scales of Total Population Change Total nA>0.2 nA<0.2 Population(Millions) nA>1 nA<1 Eastern Daylight Time (Hours) Normalized Temporal Fish Density (cyles/hr) -1 Autocorrelation Frequency (cycles/hr) Time Lag (min)
Relative Speed Between Two Populations Centers -6 -9 (km) -12 Probability -15 -18 Relative Speed (m/s) 0 3 6 9 12 (km) May 14: Time series of Relative Speed Relative Speed (m/s) Eastern Daylight Time (hours)
Conclusions • This new remote sensing technology • “is like Doppler weather radar for fish” • because it • (1) Instantaneously detects, images and continuously monitors fish population and population density over continental-shelf scales • and so • (2) reveals the detailed behavior of fish schools over wide areas. • It will be used to explore marine biology in the Gulf of Maine in 2006, • as part of the Census of Marine Life Program, with support from the Sloan Foundation, • the National Oceanographic Partnership Program and ONR.
Atlantic Herring Distribution 2000-2005 2000 2003 2001 2004 2002 2005
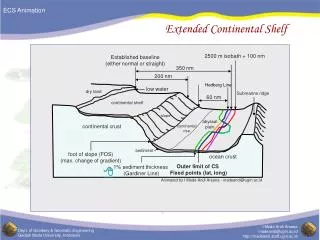
TOWED RECEIVER ARRAY MOORED SOURCE ARRAY R/V OCEANUS R/V ENDEAVOR 115-m to 230-m Variable Variable 24-m to 55-m Variable Horizontal Receiving Array 37-m to 52-m Full aperture: 277-m ULF aperture: 189-m LF aperture: 94.5-m MF aperture: 47.25-m HF aperture: 23.625-m Triplet aperture: 15.4-m Vertical Source Array Variable XF-4: 7-element MOD-30: 10-element 70-m to 140-m Seafloor LONG-RANGE BISTATIC OPS MAIN ACOUSTICS EXPERIMENT APRIL-MAY 2003
OAWRS Vertical Source Array Loading onto RV Endeavor
Expected acoustic intensity level in a fluctuating ocean(Ratilal and Makris, JASA 2005; Chen, Ratilal, Makris JASA 2005) Frequency: 415 Hz (Low pitch A)
Fish Inversion: Intermediate Steps dB Re 1m dB Re 1m dB Re 1m Two Way TL Convolved with Beam Pattern of the Array One Way TL from Source One Way TL from Receiver Distance (km) Distance (km) SPL: May 14, 09:33:25 EDT LFM: 390-440 Hz dB Re 1uPa Scattering Strength dB Fish Density Distribution Fish/m2 Distance (km) Distance (km)
Echosounder section through the fish Coventional Fish-Finding Sonar Example MAE2003 Output Courtesy of NRL 0 m Average Ship Velocity: ~3 m/s R/V Henlopen 50 m Frequency: 38 kHz Beamwidth: 6.8o 100 m Approx. 2 km -20 -30 80 m -40 -50 Layer Strength (dB) -60 -70 -80 10 m
Scup Dogfish Atlantic Mackerel Silver Hake (whiting) Atlantic Herring Black Sea Bass Red Hake Spotted Hake Fish Species Found in the Continental Shelf South of NY
Source Receiver Instantaneous OAWRS Image of Areal Fish Population Density 70m 09:32 EDT 80m Consolidated Shoal Fish Bridges connecting population centers Northings from Source (km) A small fish group Continental Shelf Edge Population Centers Vacuoles within large shoal 100m Movie Box 800m 120m Eastings from Source (km)
Instantaneous Wide-Area Detection and Imaging of Fish Schools May 14: 09:32:25 EDT May 15: 08:49:55 EDT 70m 70m 80m 80m 100m 120m 100m 120mb 200m 400m
Spatial Fish Population Density Spectrum Large Shoal Present Scattered Fish Groups Spatial Fish Population Density Spectrum (fish/m2)2 / (1/m) Spectral density is proportional to fs-1.5 Spatial Frequency fs(1/m)
Spatial and Temporal Correlation: OAWRS vs CFFS 12:09:55 EDT 12:19:55 EDT 12:29:55 EDT 11:59:05 EDT -6 100m 100m 100m 100m -9 α Northings from Source (km) -12 β γ -15 δ A D C B -18 12 0 3 6 9 Eastings from Source (km) Echogram corresponding to CFFS line transect (11:54:39-12:39:01 EDT) α β γ δ
May 14: Fish Population, Area, and Coherence Area for various density thresholds -6 -9 -12 (km) -15 -18 0 3 6 9 12 Total Population (Millions) nA>0.2 nA<0.2 nA>1 nA<1 Consolidated Shoal Area (km2) Largest fraction 2nd largest fragment Consolidated Shoal Coherent Area (km2) Largest fraction 2nd largest fragment Eastern Daylight Time (Hours)
Time Scales of Total Population Change Total nA>0.2 nA<0.2 Population(Millions) nA>1 nA<1 Eastern Daylight Time (Hours) Normalized Temporal Fish Density (cyles/hr) -1 Autocorrelation Frequency (cycles/hr) Time Lag (min)
Relative Speed Between Two Populations Centers -6 -9 (km) -12 Probability -15 -18 Relative Speed (m/s) 0 3 6 9 12 (km) May 14: Time series of Relative Speed Relative Speed (m/s) Eastern Daylight Time (hours)
Conclusions • This new remote sensing technology • “is like Doppler weather radar for fish” • because it • (1) Instantaneously detects, images and continuously monitors fish population and population density over continental-shelf scales • and so • (2) reveals the detailed behavior of fish schools over wide areas. • It will be used to explore marine biology in the Gulf of Maine in 2006, • as part of the Census of Marine Life Program, with support from the Sloan Foundation, • the National Oceanographic Partnership Program and ONR.
Atlantic Herring Distribution 2000-2005 2000 2003 2001 2004 2002 2005