Download
1 / 16
160 likes | 260 Vues
Learn how to evaluate potential bias effects in meta-analysis using R. Load, prepare, and clean data libraries like ggplot2 and metafor. Calculate effect sizes, fit models, analyze results, and explore various visualization techniques. Understand Trim and Fill methods, fail-safe N calculations, and influence assessments in meta-analysis.

E N D
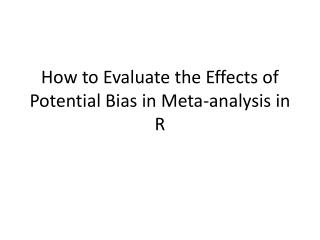
How to Evaluate the Effects of Potential Bias in Meta-analysis in R
Load, Prep, and Check library(ggplot2) library(metafor) #load the data marine <- read.csv("marine_meta_short.csv", na.strings=c("NA", ".", "")) #check variable types summary(marine)
Calculating Effect Sizes by Hand #Log Ratio marine$LR <- log(marine$Y_Poly) – log(marine$Y_Avg_Mono) marine$VLR <- with(marine, { SD_Poly^2 / (N_Poly * Y_Poly^2) + SD_Avg_Mono^2 / (N_Avg_Mono * Y_Avg_Mono^2) })
Fit a Model (we’ll talk about this soon) mod <- rma(LR, VLR, data=marine) Warning message: In rma(LR, VLR, data = marine) : Studies with NAs omitted from model fitting.
What did we find? Random-Effects Model (k = 168; tau^2 estimator: REML) … Model Results: estimate se zval pval ci.lb ci.ub 0.1324 0.0429 3.0851 0.0020 0.0483 0.2165 ** --- Signif. codes: 0 ‘***’ 0.001 ‘**’ 0.01 ‘*’ 0.05 ‘.’ 0.1 ‘ ’ 1
Many funnel types funnel(mod, main="Standard Error") funnel(mod, yaxis="vi", main="Sampling Variance") funnel(mod, yaxis="seinv", main="Inverse Standard Error") funnel(mod, yaxis="vinv", main="Inverse Sampling Variance")
trimfill(mod, side="right") Model Results: estimate se zval pval ci.lb ci.ub 0.2957 0.0493 5.9994 <.0001 0.1991 0.3923 *** --- Signif. codes: 0 ‘***’ 0.001 ‘**’ 0.01 ‘*’ 0.05 ‘.’ 0.1 ‘ ’ 1
What is Trim and Fill Doing? par(mfrow=c(1,2)) funnel(mod) funnel(trimfill(mod, side="right")) par(mfrow=c(1,1))
Fail-Safe: fsn(LR, VLR, data=marine) Fail-safe N Calculation Using the Rosenthal Approach Observed Significance Level: <.0001 Target Significance Level: 0.05 Fail-safe N: 12681
Other Types of Fail-Safe Numbers > fsn(LR, VLR, data=marine, type="Rosenberg") #based on weighted analysis Fail-safe N Calculation Using the Rosenberg Approach Average Effect Size: 0.0384 Observed Significance Level: <.0001 Target Significance Level: 0.05 Fail-safe N: 3733
Other Types of Fail-Safe Numbers > fsn(LR, VLR, data=marine, type="Orwin") #based on unweighted analysis and target effect size Fail-safe N Calculation Using the Orwin Approach Average Effect Size: 0.1091 Target Effect Size: 0.0546 Fail-safe N: 168