Working Capital Management
Working Capital Management. Chapter 18. Slide Contents. Learning Objectives Principles Used in This Chapter Working Capital Management and the Risk-Return Tradeoff Working Capital Policy Operating and Cash Conversion Cycle Managing Current Liabilities


Working Capital Management
E N D
Presentation Transcript
Working Capital Management Chapter 18
Slide Contents Learning Objectives Principles Used in This Chapter Working Capital Management and the Risk-Return Tradeoff Working Capital Policy Operating and Cash Conversion Cycle Managing Current Liabilities Managing the Firm’s Investment in Current Assets Key Terms
Learning Objectives Describe the risk-return tradeoff involved in managing a firm’s working capital. Explain the principle of self-liquidating debt as a tool for managing firm liquidity. Use the cash conversion cycle to measure the efficiency with which a firm manages its working capital.
Learning Objectives (cont.) Evaluate the cost of financing as a key determinant of the management of a firm’s use of current liabilities. Understand the factors underlying a firm’s investment in cash and marketable securities, accounts receivable, and inventory.
Principles Used in This Chapter Principle 2: There is a Risk-Return Tradeoff.
18.1 Working Capital Management and the Risk-Return Tradeoff
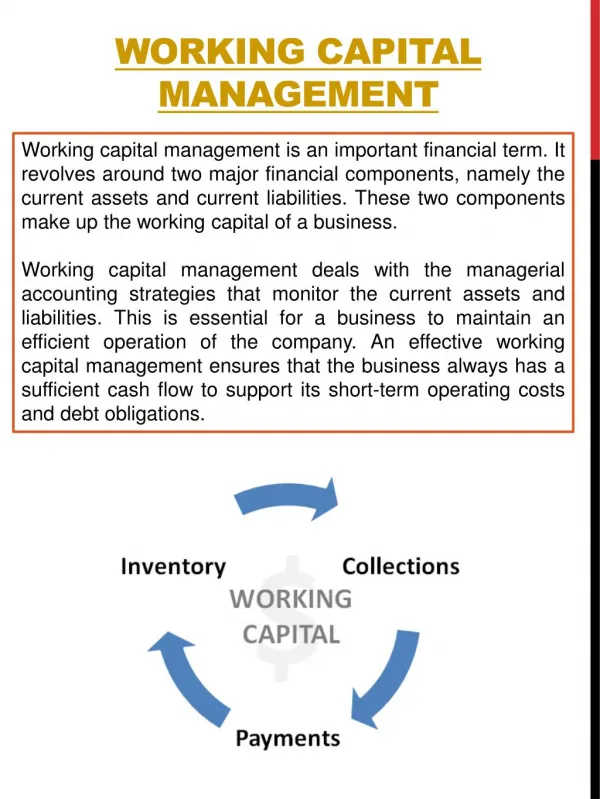
Working Capital Management and the Risk-Return Tradeoff Working capital management encompasses the day-to-day activities of managing the firm’s current assets and current liabilities. Examples of working capital decisions include: How much inventory should a firm carry? Who should credit be extended to? Should inventories be bought on credit or cash? If credit is used, when should payment be made?
Measuring Firm Liquidity The current ratio (current assets divided by current liabilities) and net working capital (current assets minus current liabilities) are two popular measures of liquidity. Both measures of liquidity provide the same information. However, current ratio can be more easily used for comparing firms.
Measuring Firm Liquidity (cont.) Here the net working capital for two firms is very different (due to differences in firm sizes) but the current ratio is equal. Current ratio is a better measure of comparison of liquidity among firms.
Managing Firm Liquidity Managing a firm’s liquidity requires balancing the firm’s investments in current assets in relation to its current liabilities. This can be accomplished by minimizing the use of current assets by efficiently managing its inventories and accounts receivable and by seeking out the most favorable accounts payable terms and monitoring its use of short-term borrowing.
Risk-Return Tradeoff Working capital decisions will change the firm’s liquidity. For example, a firm can enhance its profitability by reducing its cash and marketable securities as they yield low rates of return. However, the firm will be exposed to a higher risk of default or not being able to pay its bills on time if it does not have adequate cash and marketable securities.
Checkpoint 18.1 Measuring Firm Liquidity Ford Motor Company (F) suffered along with all the U.S. automakers with the onset of the recession in 2007. The following information from the firm’s financial statements for 2008 and 2006 provide the information needed to assess the firm’s liquidity (Note: all figures below are in $000):
Checkpoint 18.1:Check Yourself • Consider the effect on Ford’s liquidity of the firm having the opportunity to enter into a long-term financing arrangement to borrow $20 million, which could be used to reduce the firm’s 2008 accounts payable. What would be the effect of this event on the firm’s liquidity measures?
Step 1: Picture the Problem Liquidity refers to the firm’s ability to pay its bills in a timely fashion. We can determine the firm’s liquidity by comparing firm’s current assets (assets that can be converted to cash in the coming year) and current liabilities (bills the firm must pay within the year).
Step 1: Picture the Problem (cont.) We are given the following information: Note: $20 million transferred to long-term debt.
Step 1: Picture the Problem (cont.) 2008 Current Assets 2006 Current Liabilities 2008 Current Liabilities 2006 Current Assets
Step 2: Decide on a Solution Strategy Firm’s liquidity can be measured by computing the following two measures: Current Ratio = Current Assets ÷ Current Liabilities Working capital = Current Assets – Current Liabilities
Step 3: Solve Current Ratio (2008) = Current Assets ÷ Current Liabilities = $36,832,000 ÷ $58,158,000 = 0.63
Step 3: Solve (cont.) Working capital = Current Assets – Current Liabilities = $36,832,000 - $58,158,000 = -$21,326,000
Step 4: Analyze The long-term financing arrangement for $20 million improves the liquidity measures by increasing the current ratio from 0.47 to 0.63. However, it is still below the 2006 current ratio of 0.94.
Working Capital Policy Managing the firm’s net working capital involves deciding on an investment strategy for financing the firm’s current assets and liabilities. Since each financing source comes with advantages and disadvantages, the financial manager has to decide on the optimal source for the firm.
The Principle of Self-Liquidating Debt This principle states that the maturity of the source of financing should be matched with the length of time that the financing is needed. Thus a seasonal increase in inventories prior to Christmas season must be financed with short-term loan or current liability.
Permanent and Temporary Asset Investments Temporary investments in assets include current assets that will be liquidated and not replaced within the current year. For example, cash and marketable securities, accounts receivable, and seasonal fluctuation in inventories.
Permanent and Temporary Asset Investments (cont.) Permanent investments are composed of investments in assets that the firm expects to hold for a period longer than one year. For example, the firm’s minimum level of current assets such as accounts receivable and inventories, as well as fixed assets.
Spontaneous, Temporary, and Permanent Sources of Financing Spontaneous sources of financing arise spontaneously out of the day-to-day operations of the business and consist of trade credit and other forms of accounts payable (such as wages and salaries payable, tax payable, interest payable).
Spontaneous, Temporary, and Permanent Sources of Financing (cont.) Temporary sources of financing typically consist of current liabilities the firm incurs on a discretionary basis. The firm’s management must make an overt decision to use temporary sources of financing. For example, unsecured bank loans, commercial paper, short-term loans secured by the firm’s inventories or accounts receivables.
Spontaneous, Temporary, and Permanent Sources of Financing (cont.) Permanent sources of financing are called permanent since the financing is available for a longer period of time than a current liability. For example, intermediate term loans, bonds, preferred stock and common equity.
Spontaneous, Temporary, and Permanent Sources of Financing (cont.) Figure 18-2 illustrates the use of principle of self-liquidating debt to guide a firm’s financing decision. We observe that the firm’s temporary or short-term debt rises and falls with the rise and fall in the firm’s temporary investment in current assets.
Operating and Cash Conversion Cycles Operating and cash conversion cycles indicate how effectively a firm has managed its working capital. The shorter these two cycles are, the more efficient is the firm’s working capital management.
Measuring Working Capital Efficiency The operating cycle measures the time period that elapses from the date that an item of inventory is purchased until the firm collects the cash from its sale. If an item is sold on credit, this date is when the accounts receivable is collected.
Measuring Working Capital Efficiency (cont.) When the firm is able to purchase items of inventory on credit, cash is not tied up for the full length of its operating cycle. This is known as the accounts payable deferral period.
Measuring Working Capital Efficiency (cont.) Cash conversion cycle is shorter than the operating cycle as the firm does not have to pay for the items in its inventory for a period equal to the length of the account payable deferral period.
Calculating the Operating and Cash Conversion Cycle Figure 18-3 calculations are based on the following information: Annual credit sales = $15 million Cost of goods sold = $12 million Inventory = $3 million Accounts receivable = $3.6 million Accounts payable outstanding = $ 2million
Calculating the Operating and Cash Conversion Cycle (cont.) To calculate the operating cycle, we need to compute the inventory conversion period and the accounts receivable collection period.
Calculating the Operating and Cash Conversion Cycle (cont.) The inventory conversion period measures the number of days it takes the firm to convert its inventory to credit sales (i.e. accounts receivable). The second half of the operating cycle is the number of takes it takes to convert accounts receivable to cash (or average collection period).
Calculating the Operating and Cash Conversion Cycle (cont.) To calculate the cash conversion cycle, we need to calculate the accounts payable deferral period.
Calculating the Operating and Cash Conversion Cycle (cont.) We have now calculated the following: Inventory conversion period = 91 days Average collection period = 61 days Accounts payable deferral period = 61 days
Calculating the Operating and Cash Conversion Cycle (cont.) Cash conversion cycle = 176 days – 61 days = 116 days
Checkpoint 18.2 Analyzing the Cash Conversion Cycle Financial information for the Dell Computer Corporation (DELL) and Ford Motor Company (F) are found below: Compute the operating cycle and cash conversion cycle for each of these companies. You may assume for purposes of your analysis that all of the firm sales are credit sales.
Checkpoint 18.2:Check Yourself • If GM were to have an average collection period of 18.89 days, an inventory conversion period of 39.76 days and accounts payable deferral period of 60.17 days, what would its operating and cash conversion cycles be?