Fitting
Fitting. Last time: Segmentation. Group tokens into clusters that fit together foreground-background cluster on intensity, color, texture, location, … K-means graph-based. Choose a parametric object/some objects to represent a set of tokens

Fitting
E N D
Presentation Transcript
Last time: Segmentation • Group tokens into clusters that fit together • foreground-background • cluster on intensity, color, texture, location, … • K-means • graph-based University of Missouri at Columbia
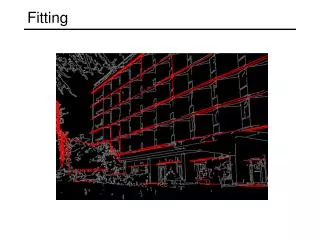
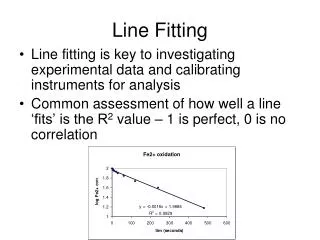
Choose a parametric object/some objects to represent a set of tokens Most interesting case is when criterion is not local can’t tell whether a set of points lies on a line by looking only at each point and the next. Three main questions: what object represents this set of tokens best? which of several objects gets which token? how many objects are there? (you could read line for object here, or circle, or ellipse or...) Fitting University of Missouri at Columbia
Hough transform : straight lines implementation : 1. the parameter space is discretised 2. a counter is incremented at each cell where the lines pass 3. peaks are detected University of Missouri at Columbia
Hough transform : straight lines problem : unbounded parameter domain vertical lines require infinite a alternative representation: Each point will add a cosine function in the (,) parameter space University of Missouri at Columbia
tokens votes University of Missouri at Columbia
Hough transform : straight lines Square : Circle : University of Missouri at Columbia
Hough transform : straight lines University of Missouri at Columbia
Construct an array representing q, d For each point, render the curve (q, d) into this array, adding one at each cell Difficulties how big should the cells be? (too big, and we cannot distinguish between quite different lines; too small, and noise causes lines to be missed) How many lines? count the peaks in the Hough array Who belongs to which line? tag the votes Hardly ever satisfactory in practice, because problems with noise and cell size defeat it Mechanics of the Hough transform University of Missouri at Columbia
tokens votes University of Missouri at Columbia
standard least-squares Line fitting can be max. likelihood - but choice of model is important total least-squares University of Missouri at Columbia
Who came from which line? • Assume we know how many lines there are - but which lines are they? • easy, if we know who came from which line • Three strategies • Incremental line fitting • K-means • Probabilistic (later!) University of Missouri at Columbia
Robustness • As we have seen, squared error can be a source of bias in the presence of noise points • One fix is EM - we’ll do this shortly • Another is an M-estimator • Square nearby, threshold far away • A third is RANSAC • Search for good points University of Missouri at Columbia
M-estimators • Generally, minimize where is the residual University of Missouri at Columbia
Too small University of Missouri at Columbia
Too large University of Missouri at Columbia
Choose a small subset uniformly at random Fit to that Anything that is close to result is signal; all others are noise Refit Do this many times and choose the best Issues How many times? Often enough that we are likely to have a good line How big a subset? Smallest possible What does close mean? Depends on the problem What is a good line? One where the number of nearby points is so big it is unlikely to be all outliers RANSAC University of Missouri at Columbia
Distance threshold Choose t so probability for inlier is α (e.g. 0.95) • Often empirically • Zero-mean Gaussian noise σ then follows distribution with m=codimension of model (dimension+codimension=dimension space) University of Missouri at Columbia
How many samples? Choose N so that, with probability p, at least one random sample is free from outliers. e.g. p=0.99 University of Missouri at Columbia
Acceptable consensus set? • Typically, terminate when inlier ratio reaches expected ratio of inliers University of Missouri at Columbia
In principle, an easy generalisation The probability of obtaining a point, given a curve, is given by a negative exponential of distance squared In practice, rather hard It is generally difficult to compute the distance between a point and a curve Fitting curves other than lines University of Missouri at Columbia
Next class: Segmentation and Fitting using Probabilistic Methods Missing data: EM algorithm Model selection Reading: Chapter 16 University of Missouri at Columbia