Mechanical Properties and Their Measurement
750 likes | 1.24k Vues
Mechanical Properties and Their Measurement. Metallurgy for the Non-Metallurgist. Learning Objectives. Upon completion of this lesson, you can: Outline the procedures for performing tensile and hardness tests List the three categories of properties measured by the tensile test

Mechanical Properties and Their Measurement
E N D
Presentation Transcript
Mechanical Properties and Their Measurement Metallurgy for the Non-Metallurgist
Learning Objectives • Upon completion of this lesson, you can: • Outline the procedures for performing tensile and hardness tests • List the three categories of properties measured by the tensile test • Describe a fatigue test in general terms • Define yield and ultimate strengths, elongation in two inches., impact toughness, creep rate, and fatigue endurance limits
Tensile Test • Load Limits • Stress • s = F/A = force/cross-sectional area
Illustration of stress as the ratio of force to cross-sectional area
Stress Stress, σ = F/A = force in Newtons(poundss) area in m2(in.2) Newton/meter2 = Pascal We use megaPascals, MPa, and KSI 15 KSI = ~103 MPa
Strain Strain, ε = Δ L / L0 Strain is dimensionless, may be elastic or plastic
Stress-Strain Curves • Stress at which a metal or alloy deforms must be established • This is the goal of the tensile test stress-strain curve • Force and stress are converted to stress and strain • Properties measured include • Yield strength • Modulus of elasticity (Young’s modulus • Ultimate strength • Elongation to fracture
Typical conventional stress-strain curve for a copper tensile sample
Early strain region of tensile stress-strain curve for copper
Variation in modulus of elasticity of iron, copper, and aluminum. Note that iron has the highest stiffness while aluminum has the lowest stiffness of the three metals.
Typical stress-strain curve of a low-carbon steel showing a yield point
New and failed tensile bars showing region of necking and reduction in cross-sectional area
Tensile stress-strain curve for metal, used to illustrate uniform elongation and necking strain
(a) Induction-hardened gear cross section. (b) Etched cross section of a carburized gear. (c) Etched cross section of a nitrided gear. Images courtesy of Caterpillar, Inc.
Micrograph illustrating the size of a Knoop microhardness indentation relative to the size of microstructural constituents in a D4 tool steel. Original magnification, 1000×
Schematic illustration of the effect of temperature on the tensile behavior of low-carbon steel. (The elastic portion of the stress-strain curves is actually nearly vertical but is sketched to illustrate that temperature decreases the modulus of elasticity as well as the yield strength.)
Effect of temperature on the impact toughness of a low-carbon steel
Effect of nickel content on the ductile-to-brittle transition of (a) low-carbon steels and (b) medium-carbon steels
Scanning electron micrographs of fracture surfaces of samples that failed in ductile and brittle fashions: (a) Typical dimpled-rupture fracture surface of a ductile fracture viewed at an original magnification of 2000× (shown at 75%) and at an angle of approximately 40–50° to the fracture surface. (b) Intergranular fracture in hardened steel. Note that fracture takes place between the grains; thus, the fracture surface has a “rock candy” appearance that reveals the shapes of part of the individual grains. Original magnification 2000×, shown at 75%
Effect of grain size on ductile-to-brittle transition temperature and yield strength of low-carbon steel
(a) Ruptured superheater tubes. Original magnification, 0.2×. (b) Creep cracks found in metallographic section of 1.25Cr-0.25Mo steel steam pipe. Original magnification, 160×; nital etch. (c) Creep cavities that are linking to form cracks visible in (b). Original magnification, 1500×; nital etch
(a) Reversed bending fatigue of a 40 mm (1.6 in.) diameter shaft of 1046 steel with a hardness of approximately 30 HRC. Note the symmetrical fatigue pattern of beach marks on each side, with the final rupture on the diameter. This indicates that each side of the shaft was subjected to the same maximum stress and to the same number of load applications. The C-shaped marks are postfracture damage. (b) Fatigue striations showing the result of spectrum loading in a laboratory test of aluminum alloy 7075-T6. In this test, the specimen was loaded ten cycles at a high stress, then ten at a lower stress, and alternated with these stresses as the fatigue crack continued to propagate. This produced ten large striations, then ten small striations, alternately, across the fracture surface. Original magnification, 4900×
A stress vs. number of cycles to failure, or S-N, curve for a fatigue test of a steel
Major causes of fatigue failure • Design! Keyways! • Must use chamfers, avoid stress raisers • Corrosion can create stress risers
Grain Size Small grains favorable for strength and fatigue resistance Large grains favorable at high temperatures ASTM Grain Size Number, N: Number of grains/in2 at 100X = 2N-1 Now generally given in microns
Grain size and strength,Hall-Petch relationship Strength fine coarse 1/ (grain size)1/2
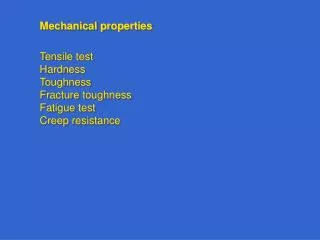
Summary • Major mechanical tests: tensile, hardness, impact, creep, and fatigue • Behavior relatable to crystal structure, grain size, alloy, and dislocation response to stress • Described by ASTM standards