Download

1 / 67
670 likes | 697 Vues
Discover how cutting-edge mapping technologies reveal the hidden world of the ocean floor in Fagatele Bay National Marine Sanctuary. Dive into high-resolution data and explore the wonders beneath the waves.

E N D
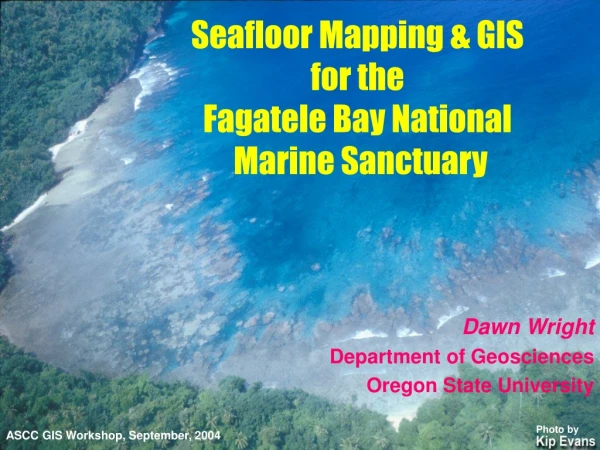
Seafloor Mapping & GIS for theFagatele Bay National Marine Sanctuary Dawn Wright Department of Geosciences Oregon State University Photo by ASCC GIS Workshop, September, 2004
Bottom Coverage & Data Density by Survey Method Leadline Single Beam Multibeam 1-2 K soundings per survey 500 - 750 K soundings per survey 400,000 – 1,000,000 K soundings per survey Image courtesy of NOAA & UNH
Active Remote SensingAcoustic! • multiple, focused, high-frequency, short wavelength sound beams • “narrow-beam” or “multibeam” bathymetry • sound beam stays narrow and focused all the way to the bottom • depths much more precise • e.g., Sea Beam has 16 beams, Sea Beam 2000 has 121, EM3000 has 127, EM120 has 191
Mapping the Ocean Floor • Only 5% of global ocean floor charted in high rez with ships - we need 125 more years! Image courtesy of NOAA
Ocean Thematic Layers Graphic courtesy of Christina Massel, Steve Miller, Scripps
Multibeam Bathymetry A Gigabyte of data an hour A Gigabyte of data a day
Fine-Scale Mapping • on the order of tens of meters to meters • features the size of a beer can!
National Marine Sanctuaries Map courtesy of NOAA National Marine Sanctuary System
U.S. Coral Reef Task Force Seeks to characterize priority reef systems deeper than 30 m in the U.S. and Trust Territories by 2009. Surveys contribute to management of marine protected areas and the possible designation of more protected areas. Evans et al. 2002;http://www.nodc.noaa.gov/col/projects/coral/Coralhome.html
OrSt & USFMultibeam Surveys to date By OrSt grad student Emily Lundblad
Shallow Multibeam(May 2001, November 2002) • Kongsberg-Simrad EM-3000 • Fans out 121 beams at 130 deg. • Swaths 3-4 times water depth • Depths in 3-150 m range at survey speeds of 3-12 knots • cm-resolution w/ dGPS
"curling up" of outermost beams"loss of bottom" on very steep slopessudden heading changes
BPI Zone and Structure Classification Flowchart Emily Lundblad, OrSt M.S. Thesis
SCUBA / Rebreather Technology Images courtesy of Kip Evans, Nat. Geographic and Rich Pyle, Bishop Museum
NOAA Biogeography“Benthic Habitat” from Ikonos By OrSt grad student Emily Lundblad
Terrain Analysis:Bathymetric Position Index(from TPI, Jones et al., 2000, Weiss, 2001) Measure of where a point is in the overall land- or “seascape” Compares elevation of cell to mean elevation of neighborhood Hilltop Middle Coarse BPI Bottom Ridge Crest Fine BPI Lava Channel
From Greene, Bizarro et al., in press, 2004, The benefits and pitfalls of GIS in marine benthic habitat mapping, in Wright, D.J. and Scholz, D.J. (eds.), Place Matters: Geospatial Tools for Marine Science, Conservation, and Management in the Pacific Northwest, Corvallis, OR: Oregon State University Press.
Terrain Analysis:Rugosity • Measure of how rough or bumpy a surface is, how convoluted and complex • Ratio of surface area to planar area Surface area based on elevations of 8 neighbors 3D view of grid on the left Center pts of 9 cells connected To make 8 triangles Portions of 8 triangles overlapping center cell used for surface area Graphics courtesy of Jeff Jenness, Jenness Enterprises, and Pat Iampietro, CSU-MB
NOAA Biogeography“Benthic Habitat” from Ikonos By OrSt grad student Emily Lundblad
Benthic Terrain ModelerBenthic Zone Classification and HabitatArcGIS 8.x
dusk.geo.orst.edu/djl/samoadusk.geo.orst.edu/djl/links.html Image courtesy of FBNMS
“Sidescan Sonar” • “aerial photograph” of seafloor • backscatter strength in addition to traveltime for bathymetry
Backscatter Image courtesy of USGS Woods Hole