Analyzing the Relationship Between Stress Levels and Life Satisfaction Using Regression Analysis
This study explores the correlation between life satisfaction (dependent variable) and stress levels (independent variable) through regression analysis. Both variables are continuous, allowing for a scatterplot to visualize the relationship. By plotting these values, we can observe patterns that indicate how variations in stress may influence overall life satisfaction. Understanding this relationship can provide insights into mental health and well-being, making it valuable for psychological research and policy development.

Analyzing the Relationship Between Stress Levels and Life Satisfaction Using Regression Analysis
E N D
Presentation Transcript
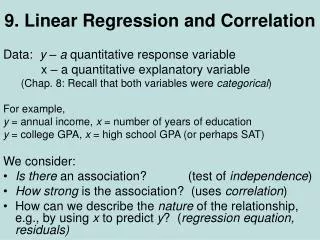
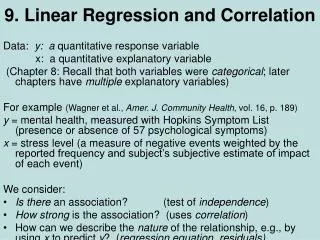
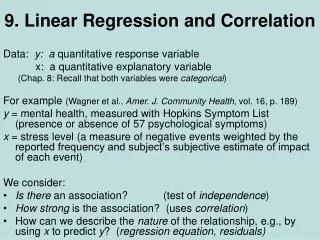
1. Class 9 Regression & Correlation Analysis
2. Regression Life satisfaction (y-axis) and stress level (x-axis), both of them are continuous variables.
You can plot the values and observe whether they form into a pattern.
3. Regression http://www.math.csusb.edu/faculty/stanton/probstat/regression.html