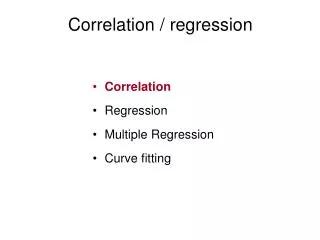
Correlation / regression
Correlation / regression. Correlation Regression Multiple Regression Curve fitting. Correlation. Represents the relationship between two measurements Examples : height and weight, education level and income, BMI and skin fold thickness, wealth and fertility

Correlation / regression
E N D
Presentation Transcript
Correlation / regression • Correlation • Regression • Multiple Regression • Curve fitting
Correlation • Represents the relationship between two measurements • Examples : height and weight, education level and income, BMI and skin fold thickness, wealth and fertility • Correlation does not represent one causing the other, usually is present if both measurements are influenced by a common factor • The value is from -1 to 1 • 0 = no relationship • 1 = perfect relationship • -1 = perfect inverse relationship
Confidence interval for r • Correlation is not a linear measurement • It stretches near 0 and compresses neat 1 or -1 • It has to be • Transformed into a normally distributed linear measurement • Have Standard Error estimated • Have CI estimated • Transformed back to the original format
Sample size • Iterative procedure that satisfy two equations • Where • Za = z value for Type I error • zb = z value for Type II error
Correlation / regression • Correlation • Regression • Multiple Regression • Curve fitting
Regression • Draw a line which best fits the relationship between x and y • The line takes the form y = a + bx • Where a is the y value when x=0 • Where b is the slope of the line, or how much y changes for one unit of change in x • It assumes that y is dependent on x • It explains how changes in y values are governed by changes in x values • It allows x to predict y • Note : x = a + by is not the mirror image of y=a +bx, as how best fit is calculated differs
Confidence interval for b t = Student’s t for sample size and Type I Error
Confidence interval for predicted y • SE 2 components and changes with x value • SE of regression slope b • SE of departure from residual variation
Correlation / regression • Correlation • Regression • Multiple Regression • Curve fitting
Multiple Regression • Outcome, particularly clinical outcome • Are subjected to multiple influences • All of which are related to each other • Multiple regression model is therefore commonly needed
BMI is influenced by mother and grandparents, but • People who married tend to have comparable BMI • Parent’s BMI tend to be dependent influenced by grandparents’ • Multiple regression y = a + b1x1 + b2x2 + b3x3 …bixi
Multiple Regression • Starts with a matrix of Sum/products [S]k,k from k measurements • where Si,j is the Sxy between any pair I and j • Where Si,i is the SSqx of variable i • This matrix is inverted [V] = [S]-1 • The Partial Regression Coefficient bi • The constant a
Correlation / regression • Correlation • Regression • Multiple Regression • Curve fitting
Curve fit • In cases where the relationship between x and y are not linear • y = function(x) • y = Log(x) • y = sine(x) • Polynomial curve fit • A special case of multiple regression • Will fit into any shape where y increases with x • y = a + b1x + b2x2 + b3x3 …..bkxk • In most biological systems fitting to the power of 3 is sufficient
Polynomial curve fit Data point y = a + b1x + b2x2 + b3x3 y = a + bx y y = a + b1x + b2x2 x
CI of polynomial fit • Complexity of calculating Standard Error • Summing of each individual coefficients • Residual • Solution – 2 stage procedure • Do polynomial curve fit • Calculate error (distance between each datapoint from the regression line) • Curve fit error
y = 14.45 – 16.66x + 5.83x2 – 0.45x3 SD = 0.29 + 0.18x
Curve fitFemur length according to gestational age Femur length (cms) Gestation (days)