Download
1 / 14
140 likes | 258 Vues
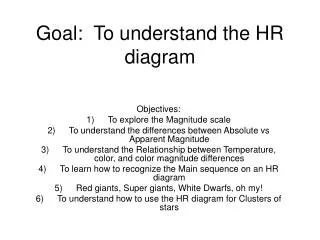
Explore how to measure the sizes of stars based on luminosity and temperature using the HR diagram. Learn about the relationships between luminosity, surface area, flux, radius, and temperature in determining star sizes. Discover the Main Sequence and Mass-Luminosity Diagram to understand the correlation between star sizes, temperatures, masses, and luminosities.

E N D
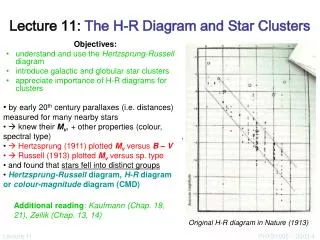
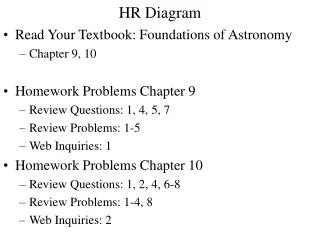
So, we know how to measure the following properties of stars… • Luminosity (from Brightness and Distance) • Mass (from Doppler shifts in Binary Stars) • Temperature (from absorption line strengths) NOW, we will learn how to measure the sizes of stars from their luminosity and temperature! But first, the HR Diagram
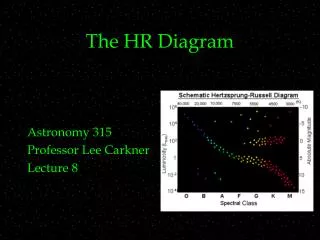
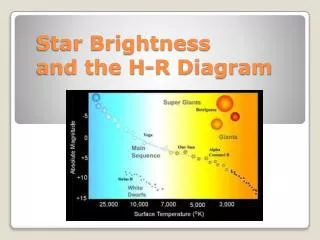
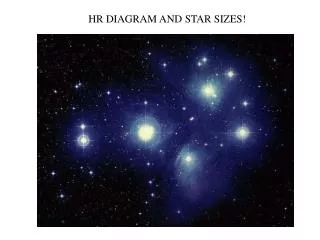
HR Diagram for Stars big & cool big & hot Units Of Sun’s small & hot small & cool
For a given star, the Luminosity depends upon two properties: • The total surface area, that emits the light • The light emitted per unit surface area (flux) R Surface area is radius dependent Area ~ R2 Flux is the light energy radiated from every unit area of the star’s surface, it is temperature dependent Flux ~ T 4 Luminosity ~ Area x Flux We have L ~ R2T 4
L ~ R2T 4 L1/2 R ~ T 2 The above relation is shown as lines of constant radius as a function of L and T …
L ~ R2 T4 Compared to the Sun…. 2 x R gives 4x L 3 x R gives 9x L 5 x R gives 25x L ½ x R gives ¼ x L 2 x T gives 16x L 3 x T gives 81x L ½ x T gives 1/16 x L 2 x R and 2 x T gives 64 x L 3 x R and ½ x T gives 9/16 x L = 0.56L ½ x R and 3 x T gives 81/4 X L = 20.25L And, so it goes…
2nd stage red giant 1st stage red giant Main Sequence Let’s Focus: THE MAIN SEQUENCE
Main Sequence Is O, B, A, F, G, K, M increasing temperature decreasing temperature increasing size decreasing size increasing luminosity decreasing luminosity This applies to the Main Sequence Only Other Luminosity Classes do NOT obey all these trends.
Main Sequence is also a Mass Sequence As temperature increases, mass increases! As mass increases, luminosity increases! Mass Luminosity Diagram HR Diagram L ~ M3.5 masses
L ~ M3.5 Compared to the Sun…. 2 x M gives 2 x 2 x 2 x sqrt(2) = 11.3 L 3 x M gives 3 x 3 x 3 x sqrt(3) = 46.7 L 5 x M gives 5 x 5 x 5 x sqrt(5) = 279 L 10 x M gives … = 3162 L 50 x M gives … = 883,900 L In other words, massive stars have very very very very large luminosities
Main Sequence Is O, B, A, F, G, K, M increasing temperature decreasing temperature increasing size decreasing size increasing mass decreasing mass increasing luminosity decreasing luminosity This applies to the Main Sequence Only Other Luminosity Classes do NOT obey all these trends.
Volume Limited Brightness Limited