Analysis of CPL Data on Water and Ice Phases During September 2012 Storm Events
This document provides an analysis of the CPL data collected on September 11 and September 27, 2012, focusing on the distribution of water and ice phases around the storm center. The dataset includes various layer heights and measurements indicating the presence of mixed phases and ice. Key lessons learned by the CPL team emphasize the need for careful temperature management and effective communication with ground crews. For additional details, see the ASCII files available at the CPL website.


Analysis of CPL Data on Water and Ice Phases During September 2012 Storm Events
E N D
Presentation Transcript
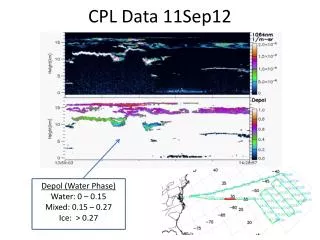
CPL Data 11Sep12 Depol(Water Phase) Water: 0 – 0.15 Mixed: 0.15 – 0.27 Ice: > 0.27
CPL Data 27Sep12 Across Storm Center S-N Box Path Around Storm Center NE E S W NW
CPL Layer Heights ASCII files available at: http://cpl.gsfc.nasa.gov Example from layers*.txt file on website LAYER 1 LAYER 2 LAYER 3 LAYER 4 02:49:21 34.0105 -20.4609 17943 -0.19 3 -999 ( 10702 9803 3 )( 8934 7884 3 )( 1349 1139 3 ) 02:49:22 34.0105 -20.4627 17943 0.05 3 -999 ( 10672 9773 3 )( 8874 7854 3 )( 1319 1019 3 ) 02:49:23 34.0105 -20.4646 17942 -0.29 3 -999 ( 10672 9833 3 )( 8904 7884 3 )( 1289 1079 3 ) 02:49:24 34.0105 -20.4664 17942 -0.23 3 -999 ( 10672 9833 3 )( 8904 7914 3 )( 1319 1079 3 ) 02:49:25 34.0105 -20.4683 17942 -0.08 3 -999 ( 10672 9773 3 )( 8754 7914 3 )( 1349 1169 3 ) 02:49:26 34.0105 -20.4701 17941 -0.09 3 -999 ( 10672 9713 3 )( 8784 8004 3 )( 1319 1139 3 ) 02:49:27 34.0105 -20.4719 17941 -0.21 3 -999 ( 10672 9773 3 )( 8814 7854 3 )( 1319 1139 3 ) 02:49:28 34.0105 -20.4738 17941 -0.31 3 -999 ( 10672 9833 3 )( 8814 7884 3 )( 1319 1109 3 ) 02:49:29 34.0105 -20.4756 17942 -0.20 3 -999 ( 10672 9893 3 )( 8754 7914 3 )( 1289 1109 3 ) 02:49:30 34.0105 -20.4774 17942 -0.16 3 -999 ( 10702 9833 3 )( 8904 7884 3 )( 1289 1079 3 )
Lessons Learned – CPL Team • PMOF too cold! • CPL will overheat if powered on and there is a takeoff delay. • Must make sure communications with ground crew are clear and finalized. • Do groups have feedback on utility of CPL real-time images?