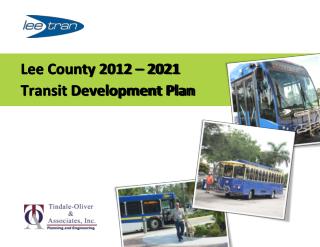
HART Transit Development Plan
HART Transit Development Plan. June 20, 2011. Overview. TDP Purpose Plan Elements Vision Plan Status Quo Plan Action Program Next Steps. Transit Development Plan . Multi-year business plan Situation Appraisal Issues affecting HART Anticipated revenues

HART Transit Development Plan
E N D
Presentation Transcript
HART Transit Development Plan June 20, 2011
Overview • TDP Purpose • Plan Elements • Vision Plan • Status Quo Plan • Action Program • Next Steps
Transit Development Plan • Multi-year business plan • Situation Appraisal • Issues affecting HART • Anticipated revenues • Prioritized service and capital projects • FDOT requirement • Major update every 5 years • Annual progress updates • Provides framework for revised strategic plan • Assessment, priorities and strategies
Issues Affecting Transit • Population growth • 1.23 Million in 2010 1 • 20% increase since 2000 • Higher growth in unincorporated county – 30%; 17% for cities • 70.6% increase in Hispanic or Latino population • Additional growth projected • 1.73 Million – 2035 (38% increase) 2 • 1.47 Million – 2021 (17% increase)3 • 2010 US Census • MPO 2035 LRTP Projection • Interpolation of MPO 2035 LRTP projection
Service Challenges • Limited transit service • Inadequate service on existing routes • Many areas in County not served • Lower per capita spending compared to other areas* * Source: 2009 NTD Data
Development Patterns Service Patterns
Productivity by Route Service supply • 95% Local • 3.3% Express • 1.7% Circulator
63% of Local Ridership on 10 Routes USF Westshore Downtown Tampa
Fixed Route Trends FY 2006 – FY 2011 Ridership, Service, Productivity and Cost
Fixed Route Implications • Strong ridership growth • 14.6% ridership increase: 2006 – 2010* • 14% increase: 1st 8 months of FY2011 • More productive service • Result of past service restructuring efforts • Service modifications-proposed FY12 budget (6% )** • Impacts ridership (2% decline) • * Ridership per GFI farebox data • ** Service reductions represented as total miles (compared to FY 11 budget)
Paratransit Trends FY 2006 – FY 2011 Ridership, Service, Productivity and Cost
Paratransit Implications • Strong Ridership Growth • 65% increase 2006-2010 • 18% increase – 1st 8 months of FY2011 • Service reductions from other agencies contribute to ridership growth • High service cost • $33.35/passenger trip * • Stringent federal requirements • Continued focus on efficiency strategies • * Proposed FY 12 budget
Revenue • Continued decline in ad valorem • 21% between FY2008 and FY2012 (Projected with .5 mil) • 27% decline with .4682 mil • Uncertainty and potential reductions • Ad valorem exemptions • Federal and State funding
Vision Plan • Program of services and projects to address County mobility needs • Defines community’s vision for transit over the long term
Vision Plan • Development Process • Projects and services drawn from last year’s Rapid Transit Investment Plan (RTIP) • Updated to reflect additional analysis • Demographics and development patterns • Local and regional policies/plans • Other agency initiatives • RTIP scope revised to address financial issues • Light rail projects not feasible with existing funding
Vision Plan Bus-Oriented Focus • Local, express, flex, paratransit • Lower cost strategies on major corridors • Bus Rapid Transit • Express service on dedicated lanes
Status Quo Plan • Services and projects implemented with existing funding sources • Ad valorem, state and federal, passenger fares, miscellaneous • Coordinated with FY 2012/2013 Budget development • Additional projections to FY 2021 • Needs and revenues
Status Quo Operating Plan • FY 12 - FY13 balanced (Proposed budget: bus and paratransit) • Reduced expenses – service and administrative • Enhanced revenues – fare increase, ad valorem increase, additional federal funding • Shortfall starting in FY2014 • Increased expenses: MetroRapid N-S, Fuel, Insurance • Reduced revenues • Elimination of non recurring revenue
Status Quo Capital Plan • FY 2012 and 2013 • Facility upgrades, state of good repair, buses, park and ride, MetroRapid N-S • Prior year funding awards: Federal and County • Future Capital Needs • State of Good Repair • Fleet, facilities, infrastructure • Improved Access to Transit • Accessibility • Transit Signal Priority – Countywide • Enhanced fareboxes – Smartcard, Open Payment • Additional technology • Energy Initiatives • CNG fueling facility/Maintenance modifications • Solar panels
Status Quo Capital Plan • Beginning in 2014: Cost of Needs > Programmed Revenues • Uncertainty with Federal & State revenues • Federal earmarks and flexible funding • Formula funds – level and amount of funding required for Operating Budget • State block and competitive funding
Status Quo Plan Bus Acquisition • FY 2012 and 2013 • Bus replacement and MetroRapid North-South • Program funded - prior year federal funding • FY 2014-FY 2021 • 237 buses and vans needed – all replacement • Uncertain Federal funding
Action Program • Strategies to address needs and challenges • Efficiency strategies • Funding opportunities • Partnerships • Other initiatives • Enhanced access • Planning efforts • Energy/sustainability projects
Action Program • Continued Efficiency Strategies • Service restructuring • Paratransit demand management • Real time scheduling • Fare incentives • Use of smaller vehicles • Review service coordination opportunities • Sunshine Line, USF • Consortium purchases with other agencies • Evaluation of additional outsourcing opportunities
Action Program • Funding Opportunities • Competitive funding applications • State • Federal • Participate in MPO Interagency Working Group • Review alternative funding sources • Other Initiatives • Concessions • Broader U-Pass application (Post-secondary institutions) • Additional advertising
Action Program • Partnerships • Tampa Hillsborough Expressway Authority(THEA) • Feasibility study of bus toll lane concept • Price managed lane • Higher tolls in peak periods • Used by HART buses • Used by HART buses • Potential operating funding for HART • Hillsborough County Aviation Authority • TIA Master Plan Update • Opportunities for shared intermodal center • Governmental and other transit agencies • Service coordination • Additional consortium purchases
Action Program • Enhanced Access • Accessibility improvements at stops and facilities • Fare payment options (smartcard, credit/debit) • Customer information (next bus arrival, cell phone applications) • Wi-Fi on buses • Online trip reservations (flex and paratransit) • Energy/Sustainability Initiatives • Alternative fuel – CNG for fleet • Solar panels • LEED certification for 21st Avenue facility
Action Program • Planning Initiatives • MPO ‘Post Referendum’ analysis • Lower cost service strategies • Incremental approach to expanding transit • Funding options • City of Tampa Sustainability Study • Transit supportive development strategies • Downtown and Nebraska Avenue corridor
Next Steps • Preparation of draft report • Integrate public feedback and technical analysis • HART Board review • July 18 Finance Committee • August 1 Board