Hypothesis Testing for Means and Proportions: Examples and Guidelines
This section discusses hypothesis testing for means (small samples) using t-distribution and proportions using z-test. It covers guidelines for conducting the tests, finding critical values, making decisions, and interpreting results. The examples focus on testing claims about means and proportions in various contexts.

Hypothesis Testing for Means and Proportions: Examples and Guidelines
E N D
Presentation Transcript
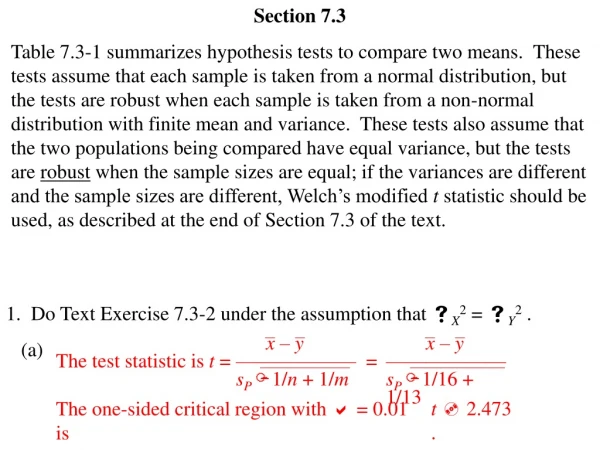
Section 7.3 Hypothesis Testing for the Mean (Small Samples)
Similar to section 7.2… When the distribution is normal (or nearly normal), n < 30 or σ is unknown. • Use the t-distribution table: • Degrees of freedom: d.f. = n – 1
EX: find critical value, t0 • Left tailed test, α = 0.01, n = 13 • Right tailed test, α = 0.10, n =10 • Two tailed test, α = 0.05, n = 22
Guidelines for the t-Test • find H0 and Ha • Identify the level of significance, α • Identify the degrees of freedom, d.f. • Find the critical value(s) using the table. • Sketch the curve and shade the rejection region(s) • Find t • Make the decision to reject or not reject H0 • Interpret the decision in context.
Use a t-test to test the claim • 14. Claim: µ > 25, α = 0.05, sample mean = 26.2, s = 2.32, n = 17 • 15. Claim: µ > 8000, α = 0.01, sample mean = 7700, s = 450, n = 25
18. A company claims that the mean battery life of their MP3 player is at least 30 hours. You suspect that the claim is incorrect and find that a random sample of 18 MP3 players has a mean battery life of 28.5 hours and a standard deviation of 1.7 hours. Is there enough evidence to reject the claim at alpha = 0.01?
A repair shop believes that people travel more than 3500 miles between oil changes. A random sample of 8 cars getting an oil change has a mean distance of 3375 miles since the last oil change with a standard deviation of 225 miles. At alpha = 0.05, do you have enough evidence to support the shop’s claim?
Section 7.4 HYPOTHESIS TESTING FOR PROPORTIONS
Guidelines for the z-Test • np and nq both must be at least 5 • 1. find H0 and Ha • 2. identify α • 3. find the critical value(s) • 4. shade the rejection region(s) • 5. calculate z • 6. make decision to reject or not reject the null hypothesis • 7. interpret decision in context
Determine if a normal distribution can be used. If so, test the claim.
A research center claims that 16% of US adults say that curling is the Winter Olympic sport they would like to try the most. In a random sample of 300 US adults, 20% say that curling is the Winter Olympic sport they would like to try the most. At α = 0.05, is there enough evidence to reject the researcher’s claim?
A research center claims that at most 75% of US adults think that drivers are safer using hands-free cell phones instead of using hand-held cell phones. In a random sample of 150 US adults, 77% think that drivers are safer using hands-free cell phones instead of hand-held cell phones. At α = 0.01, is there enough evidence to reject the center’s claim?