Small Sample Hypothesis Testing Techniques
Learn to find critical values, conduct t-tests, and interpret results using t-distribution with limited samples. Understand degrees of freedom, significance levels, and statistical decision-making. Explained with examples and practical applications.

Small Sample Hypothesis Testing Techniques
E N D
Presentation Transcript
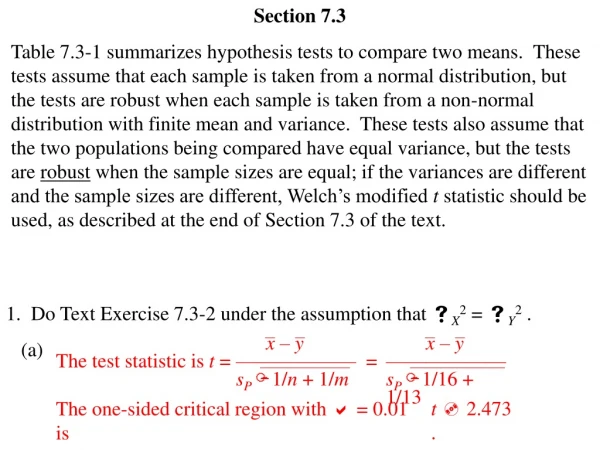
Section 7.3 Hypothesis Testing for the Mean (Small Samples) Larson/Farber 4th ed.
Section 7.3 Objectives • Find critical values in a t-distribution • Use the t-test to test a mean μ • Use technology to find P-values and use them with a t-test to test a mean μ Larson/Farber 4th ed.
Finding Critical Values in a t-Distribution • Identify the level of significance . • Identify the degrees of freedom d.f. = n – 1. • Find the critical value(s) using Table 5 in Appendix B in the row with n – 1 degrees of freedom. If the hypothesis test is • left-tailed, use “One Tail, ” column with a negative sign, • right-tailed, use “One Tail, ” column with a positive sign, • two-tailed, use “Two Tails, ” column with a negative and a positive sign. Larson/Farber 4th ed.
Example: Finding Critical Values for t Find the critical value t0 for a left-tailed test given = 0.05 and n = 21. • Solution: • The degrees of freedom are d.f. = n – 1 = 21 – 1 = 20. • Look at α = 0.05 in the “One Tail, ” column. • Because the test is left-tailed, the critical value is negative. 0.05 t -1.725 0 Larson/Farber 4th ed.
Example: Finding Critical Values for t Find the critical values t0 and -t0 for a two-tailed test given = 0.05 and n = 26. • Solution: • The degrees of freedom are d.f. = n – 1 = 26 – 1 = 25. • Look at α = 0.05 in the “Two Tail, ” column. • Because the test is two-tailed, one critical value is negative and one is positive. 0.025 0.025 t -2.060 0 2.060 Larson/Farber 4th ed.
t-Test for a Mean μ (n < 30, Unknown) t-Test for a Mean • A statistical test for a population mean. • The t-test can be used when the population is normal or nearly normal, is unknown, and n < 30. • The teststatistic is the sample mean • The standardizedteststatistic is t. • The degrees of freedom are d.f. = n – 1. Larson/Farber 4th ed.
Using the t-Test for a Mean μ(Small Sample) In Words In Symbols • State the claim mathematically and verbally. Identify the null and alternative hypotheses. • Specify the level of significance. • Identify the degrees of freedom and sketch the sampling distribution. • Determine any critical value(s). State H0 and Ha. Identify . d.f. = n – 1. Use Table 5 in Appendix B. Larson/Farber 4th ed.
Using the t-Test for a Mean μ(Small Sample) In Words In Symbols Determine any rejection region(s). Find the standardized test statistic. Make a decision to reject or fail to reject the null hypothesis. Interpret the decision in the context of the original claim. If t is in the rejection region, reject H0. Otherwise, fail to reject H0. Larson/Farber 4th ed.
Example: Testing μ with a Small Sample A used car dealer says that the mean price of a 2005 Honda Pilot LX is at least $23,900. You suspect this claim is incorrect and find that a random sample of 14 similar vehicles has a mean price of $23,000 and a standard deviation of $1113. Is there enough evidence to reject the dealer’s claim at α = 0.05? Assume the population is normally distributed. (Adapted from Kelley Blue Book) Larson/Farber 4th ed.
μ ≥ $23,900 μ < $23,900 Solution: Testing μ with a Small Sample • H0: • Ha: • α = • df = • Rejection Region: • Test Statistic: • Decision: 0.05 Reject H0 14 – 1 = 13 At the 0.05 level of significance, there is enough evidence to reject the claim that the mean price of a 2005 Honda Pilot LX is at least $23,900 0.05 t -1.771 0 -1.771 -3.026 Larson/Farber 4th ed.
Example: Testing μ with a Small Sample An industrial company claims that the mean pH level of the water in a nearby river is 6.8. You randomly select 19 water samples and measure the pH of each. The sample mean and standard deviation are 6.7 and 0.24, respectively. Is there enough evidence to reject the company’s claim at α = 0.05? Assume the population is normally distributed. Larson/Farber 4th ed.
μ = 6.8 μ ≠ 6.8 Solution: Testing μ with a Small Sample • H0: • Ha: • α = • df = • Rejection Region: • Test Statistic: • Decision: 0.05 Fail to reject H0 19 – 1 = 18 At the 0.05 level of significance, there is not enough evidence to reject the claim that the mean pH is 6.8. 0.025 0.025 t -2.101 0 2.101 -2.101 2.101 -1.816 Larson/Farber 4th ed.
Example: Using P-values with t-Tests The American Automobile Association claims that the mean daily meal cost for a family of four traveling on vacation in Florida is $118. A random sample of 11 such families has a mean daily meal cost of $128 with a standard deviation of $20. Is there enough evidence to reject the claim at α = 0.10? Assume the population is normally distributed. (Adapted from American Automobile Association) Larson/Farber 4th ed.
μ = $118 μ ≠ $118 Solution: Using P-values with t-Tests • H0: • Ha: TI-83/84set up: Calculate: Draw: 0.1664 > 0.10 • Decision: Fail to reject H0. At the 0.10 level of significance, there is not enough evidence to reject the claim that the mean daily meal cost for a family of four traveling on vacation in Florida is $118. Larson/Farber 4th ed.
Section 7.3 Summary • Found critical values in a t-distribution • Used the t-test to test a mean μ • Used technology to find P-values and used them with a t-test to test a mean μ Larson/Farber 4th ed.