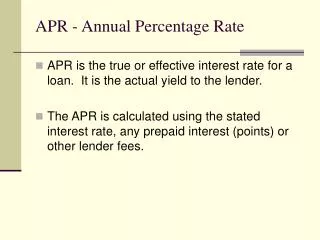
Download
1 / 4
40 likes | 75 Vues
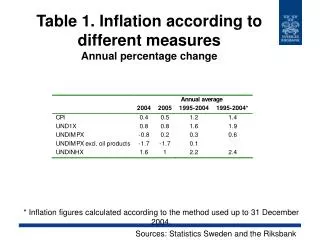
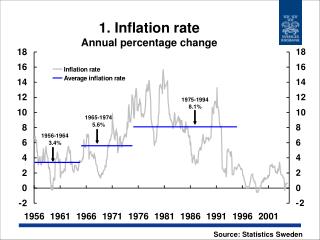
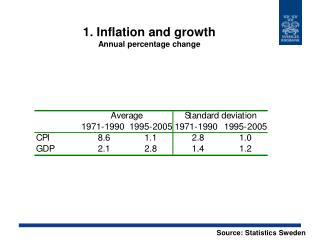
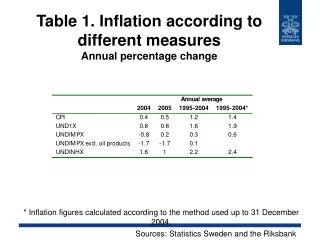
Table 1. Inflation according to different measures Annual percentage change. * Inflation figures calculated according to the method used up to 31 December 2004. Sources: Statistics Sweden and the Riksbank.

E N D
Table 1. Inflation according to different measuresAnnual percentage change * Inflation figures calculated according to the method used up to 31 December 2004. Sources: Statistics Sweden and the Riksbank
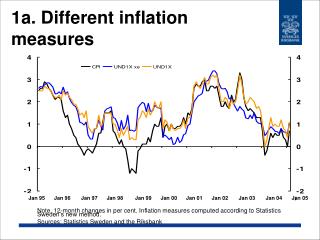
Figure 1. The Riksbank’s forecasts at different times for underlying inflation (UND1X) in 2004 and 2005Annual average Sources: Statistics Sweden and the Riksbank Note. Inflation 2004 is calculated according to the method used up to 31.12.2004.
Figure 2. Forecasts at different times for CPI inflation 2005, compared with other forecastersAnnual average Note. Dating according to Consensus Inc. publications. Sources: Consensus Inc., the Ministry of Finance, LO and Statistics Sweden
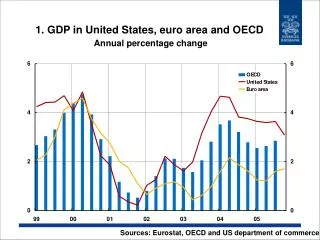
Figure 3. Forecasts at different times for GDP growth 2004, the Riksbank compared with other analystsAnnual average Note.Dating according to Consensus Inc. publications. Sources: Consensus Inc., the Ministry of Finance, LO and Statistics Sweden