Download
1 / 10
100 likes | 382 Vues
1a. Different inflation measures. Jan 95 Jan 96 Jan 97 Jan 98 Jan 99 Jan 00 Jan 01 Jan 02 Jan 03 Jan 04 Jan 05. Note. 12-month changes in per cent. Inflation measures computed according to Statistics Sweden’s new method.

E N D
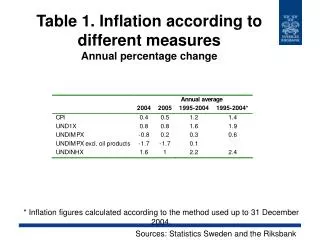
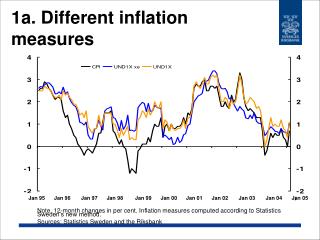
1a. Different inflation measures Jan 95 Jan 96 Jan 97 Jan 98 Jan 99 Jan 00 Jan 01 Jan 02 Jan 03 Jan 04 Jan 05 Note. 12-month changes in per cent. Inflation measures computed according to Statistics Sweden’s new method. Sources: Statistics Sweden and the Riksbank
1b. Different inflation measures CPI UND1X UND1X excluding energy Note. 12-month changes in per cent. Inflation measures computed according to Statistics Sweden’s old method. Sources: Statistics Sweden and the Riksbank
2. Inflation: goods and services (excl. oil, energy and mortgage interest) Jan 95 Jan 96 Jan 97 Jan 98 Jan 99 Jan 00 Jan 01 Jan 02 Jan 03 Jan 04 Jan 05 Note. 12-month changes in per cent. Inflation measures computed according to Statistics Sweden’s new method. Source: The Riksbank
3. Consumer goods Imported goods Domestic goods Jan 95 Jan 96 Jan 97 Jan 98 Jan 99 Jan 00 Jan 01 Jan 02 Jan 03 Jan 04 Jan 05 Note. 12-month changes in per cent. Inflation measures computed according to Statistics Sweden’s new method. Source: The Riksbank
4. Goods in consumer and producer channel Jan 98 Jan 99 Jan 00 Jan 01 Jan 02 Jan 03 Jan 04 Jan 05 Note. 12-month changes in per cent. Inflation measures computed according to Statistics Sweden’s new method. Sources: Statistics Sweden and the Riksbank
5. Product price, intermediate goods and profit margin in Swedish manufacturing sector Note. Intermediate goods and product price are annual percentage changes, profit margin is the level in per cent of the value of gross output. Source: National Institute of Economic Research.
6. ULC, labour costs and productivity in manufacturing Note. Annual percentage changes. Source: National Institute of Economic Research.
7. SEK/TCW, UNDIMPX xe and imported consumer goods Note. 12-month changes in per cent. Source: Statistics Sweden and the Riksbank
8. Unit labour costs Note. Annual percentage changes. Source: National Institute of Economic Research.
9. Profit margins Note. Level as per cent of the value of gross output. Source: National Institute of Economic Research.