Download
1 / 27
270 likes | 310 Vues
Explore polynomial classification by degree and number of terms, identify end behavior patterns, and analyze local extrema. Understand how polynomial functions behave at the far left and far right ends of their graphs. Practice identifying end behavior and local maxima and minima.

E N D
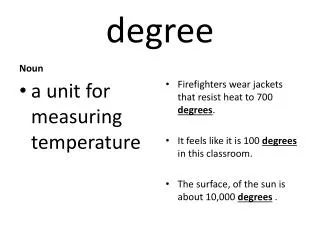
Degree The degree is the value of the greatest exponent of any expression or term in a polynomial. 1) 8x - 3x2 + x4 - 4 x4 - 3x2 + 8x – 4 The degree is FOUR • x6 – 3x3 + x4 + 5 x6 + x4 – 3x3 + 5 The degree is SIX
Classification of a Polynomial n = 0 constant 3 linear n = 1 5x + 4 quadratic n = 2 2x2 + 3x - 2 cubic n = 3 5x3 + 3x2 – x + 9 quartic 3x4 – 2x3 + 8x2 – 6x + 5 n = 4 n = 5 -2x5 + 3x4 – x3 + 3x2 – 2x + 6 quintic
Term Parts of your polynomial. 8x - 3x2 + x4 - 4 FOUR TERMS x6 – 3x3 TWO TERMS
Classification of a Polynomial 3 one Monomial 5x + 4 two Binomial 2x2+3x - 2 three Trinomial 5x3 + 3x2 – x + 9 Polynomial four 3x4 – 2x3+8x2 – 6x + 5 Or more… Polynomial
P(x) = 3x3- 32x2 + 48x + 3x Degree ____ Number of Terms___ Name: ______________________ y= x2(-2x + 12) – 2x + 43 Simplify first -2x3 + 12x2 – 2x + 43 Degree ____ Number of Terms___ Name: ______________________
Classify each polynomial by degree and by number of terms. a) 5x + 2x3 – 2x2 cubic trinomial b) x5 – 4x3 – x5 + 3x2 + 4x3 quadratic monomial c) x2 + 4 – 8x – 2x3 cubic polynomial quintic trinomial d) 3x3 + 2x – x3 – 6x5 7th degree binomial e) 2x + 5x7 Not a polynomial
Domain: • Range: • What are the domain and range of • 𝑃(𝑥)=3𝑥3 − 32𝑥2 + 48𝑥 +𝑥3 • Let’s say that this polynomial represents a football player’s average speed over the amount of time he has been at practice. What is the practical domain for the function now? What is the practical range?
End Behavior of Functions The end behavior of a graph describes the far left and the far right portions of the graph. Using the leading coefficient and the degree of the polynomial, we can determine the end behaviors of the graph. This is often called the Leading Coefficient Test.
End Behavior of Functions First determine whether the degree of the polynomial is even or odd. degree = 2 so it is even Next determine whether the leading coefficient is positive or negative. Leading coefficient = 2 so it is positive
END BEHAVIOR Degree: Even Leading Coefficient: + End Behavior: UpUp f(x) as x f(x) as x
END BEHAVIOR Degree: Even Leading Coefficient: End Behavior: DownDown f(x) as x f(x) as x
END BEHAVIOR Degree: Odd Leading Coefficient: pos End Behavior: Down Up f(x) as x f(x) as x
END BEHAVIOR Degree: Odd Leading Coefficient: neg End Behavior: UpDown f(x) as x f(x) as x
END BEHAVIOR PRACTICE Give the End Behavior:
END BEHAVIOR PRACTICE Give the End Behavior: Up Down Up Up Down Up Down Down
There are several different elements to examine on the graphs of polynomial functions: Local minima and maxima: Polynomial Functions and Their Graphs
Give the Local Maxima and Minima Must use y to describe High and Low On the graph above: A local maximum: f(x) = A local minimum: f(x) =
Finding a local max and/or local min is EASY with the calculator! Graph each of the following and find all local maxima or minima: Now describe their end behavior.
Describe the Interval of Increasing and Decreasing Must use x to describe Left to Right (Left to Right) The graph is: y x Increasing when ___________ Decreasing when _____________ Increasing when ___________
Give the maximums and minimums and describe the intervals of increasing and decreasing, for each of the following:
Give the maximum and minimums and describe the intervals of increasing and decreasing, for each of the following:
Now, let’s do it on our own: For each of the following: • sketch the graph • find the points at which there is a local max or min • describe the intervals in which the function is increasing or decreasing • describe the end behavior
Now, let’s do it on our own: For each of the following: • sketch the graph • find the points at which there is a local max or min • describe the intervals in which the function is increasing or decreasing • describe the end behavior