Download
1 / 20
200 likes | 244 Vues
Investigating the changing photochemistry in the North Pacific region through INTEX-B observations of reactive nitrogen. Analyzing ozone production rates, LIF detection methods, and flight data.

E N D
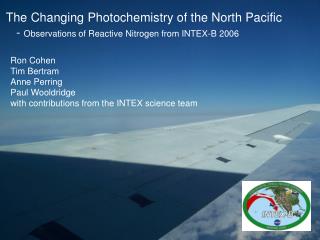
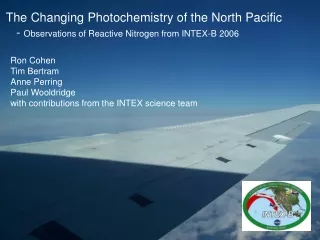
The Changing Photochemistry of the North Pacific - Observations of Reactive Nitrogen from INTEX-B 2006 Ron Cohen Tim Bertram Anne Perring Paul Wooldridge with contributions from the INTEX science team
Changing Photochemistry of the North Pacific Richter et al., Nature 2005
Ozone Production Rates INTEX-A PBL INTEX-B All
PMT sample Multi-pass Cell ( 1 of 2 ) To Pump Nd3+:YAG 585 nm Tunable Dye Laser 532 nm Detection Limit [S/N=2]: 25pptv @10seconds at 12km 10pptv @10seconds on ground LIF Detection of NO2 UCB LIF on the DC-8 Thornton et al., Anal. Chem. 2000
TD-LIF Detection of SPNs, SANs and HNO3 XNO2 + heat X + NO2 T< 50C NO2 (1) T~ 200C N2O5+RO2NO2 +(1) (2) T~ 300C RONO2 + (2) (3) T~ 550C HNO3+ (3) (4) Day et al., JGR. 2002
TD-LIF Sampling Strategy Sample at 4Hz in a 2 minute sampling cycle 90 seconds NO2 60 seconds SPNs 15 seconds SANs 30 seconds NOy(-NO) 15 seconds HNO3
Reactive Nitrogen & Ozone: Remote Pacific N North S South NOy = NO+ NO2 +SPNs + SANs +HNO3
NOy Partitioning: Remote Pacific N North S South
TD-LIF Flight Data 15 May 2006 - Anchorage to North Dakota
TD-LIF Flight Data 15 May 2006 - Anchorage to North Dakota
TD-LIF Flight Data 15 May 2006 - Anchorage to North Dakota
TD-LIF Flight Data 15 May 2006 - Anchorage to North Dakota
PAN and SPNS Expect: [PAN] ~ 0.85 [SPNs]
SANs and C1-C4 ANs SANs C1-C4 (Blake group)
Comparison to Previous Observations: North Pacific [Latitude > 35N] North
Comparison to Previous Observations: South Pacific [Latitude < 35N] South
Questions and Directions • Further intercomparison of satellite and in situ data • Use NO2/HNO3 and age of air to explore sources of NOx/y and convective influences • Document Intercomparisons of TD-LIF with other airborne measurements during INTEX-B • Compare and Contrast modeled composition of SANs and abundances of individual ANs in INTEX-A, and both phases of INTEX-B • Compare observations to previous Pacific Missions
PAN Thermal Dissociation: Remote Pacific N North S South
In situ constraints for satellite observations of NO2 from OMI