1 / 24

5 Year Results: New York State’s Childhood Lead Poisoning Primary Prevention Program

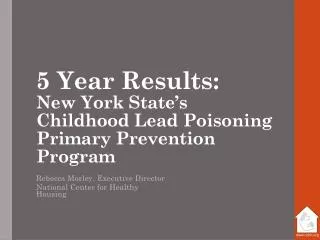
5 Year Results: New York State’s Childhood Lead Poisoning Primary Prevention Program. Rebecca Morley, Executive Director National Center for Healthy Housing . Background. 2000 U.S. Census Data New York State. Nearly 1.7 million children under age six;

gefjun
Télécharger la présentation

5 Year Results: New York State’s Childhood Lead Poisoning Primary Prevention Program

An Image/Link below is provided (as is) to download presentation Download Policy: Content on the Website is provided to you AS IS for your information and personal use and may not be sold / licensed / shared on other websites without getting consent from its author. Content is provided to you AS IS for your information and personal use only. Download presentation by click this link. While downloading, if for some reason you are not able to download a presentation, the publisher may have deleted the file from their server. During download, if you can't get a presentation, the file might be deleted by the publisher.

E N D

Presentation Transcript


  1. 5 Year Results: New York State’s Childhood Lead Poisoning Primary Prevention Program Rebecca Morley, Executive Director National Center for Healthy Housing

  2. Background

  3. 2000 U.S. Census Data New York State • Nearly 1.7 million children under age six; • 476,000 children aged one and two years; • Third in the nation for families with children under age five living in poverty; • 23% of the population born outside the U.S.; • Over 3.3 million homes built before 1950.

  4. The Number and Prevalence of Children with BLLs above 5µg/dL in 2011 in NYS

  5. Prevalence of Childhood Lead Poisoning

  6. Sources and Societal Impacts

  7. Childhood Lead Poisoning Prevention Program - CLPPPNew York State, 2007

  8. Primary Prevention Program Grantees by Year of Entrance

  9. NY State CLPPP 8 original pilot locations funded in 2007 15 grantees operating through 2013

  10. Results

  11. Cumulative Results October 1, 2007 – March 31, 2013

  12. Visited Housing Unit Characteristics

  13. 3% “deputized” other agency staff Inspections 29% “deputized” code enforcement staff 68% CLPPP Staff

  14. EnforcementNumber of Additional Enforcement Actions Taken

  15. BenefitsAverage Annual Number of Units Visited and Children Impacted

  16. New York City, Oneida, and Onondaga

  17. New York City Program Impact

  18. New York City Greatest Success

  19. Oneida Program Impact

  20. Oneida Greatest Success

  21. Onondaga Program Impact

  22. Onondaga Greatest Success

  23. Moving Forward

  24. Lessons for Other States

More Related