Download
1 / 24
240 likes | 422 Vues
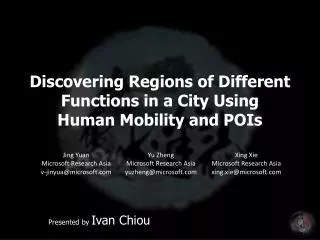
Discovering Regions of Different Functions in a City Using Human Mobility and POIs. Presented By Ningzhou Zeng April 7, 2014. I ntroduction.

E N D
Discovering Regions of Different Functions in a City Using Human Mobility and POIs Presented By Ningzhou Zeng April 7, 2014
Introduction The step of urbanization and modern civilization leads to different functional regions in a city, e.g., residential areas, business districts, and educational areas It support different needs of people’s urban lives and serve as a valuable organizing technique for framing detailed knowledge of a metropolitan. To identify the functions of a region, we need to take into account both POIs located in a region and human mobility among these regions.
Discovers Regions of different Functions • Point of interests(POIs): POIs feature the function of a region. For example, a region containing a number of universities and schools has a high probability to be an educational area. On the other hand, a region usually contains a variety of POIs, thereby having compound functions instead of a single function. • Human mobility: The functions of a region have a strong correlation with the traveling behavior of people who visit the region. Lies in: When people arrive at and leave a region. Where people come from and leave for.
Topic model-based method Framework for discovering the functional regions
DISCOVERY OF REGION TOPICS Map Segmentation Connected Component Labeling A road network is usually comprised of some major roads like highways and ring roads, which naturally partition a city into regions.
Topic Discovery • Preliminary DEFINITION 1 (TRANSITION). A transition Tr is a quaternion containing the following four items: origin region (Tr. ro), leaving time (Tr. tL), destination region (Tr, rD) and arrival time (Tr, tA). Here, Tr. roand Tr.rD are spatial features while the others are temporal features.
Topic Discovery DEFINITION 2 (MOBILITY PATTERN). A mobility pattern M is a triple extracted from a transition. Given a transition Tr= (Tr.ro, Tr.rD, Tr.tL, Tr.tA). We obtain two mobility patterns: the leaving mobility pattern ML= (Tr.ro, Tr.rD, Tr.tL), and the arriving mobility pattern MA= (Tr.ro, Tr.rD, Tr.tA).
Topic Discovery DEFINITION 3 (TRANSITION CUBOIDS). A transition cuboid C is an R×R×T cuboid, where R is the number of region and T is the number of time bins. Since there exist two types of mobility patterns, we define two types of transition cuboids: leaving cuboid CL and arriving cuboid CA. The cell with index (i,j,k) of the leaving cuboid records the number of mobility patterns that leave ri for rj at time tk, i.e. Similary,
Concept of Topic Models Latent Dirichlet Allocation (LDA): 1) Let α: the Dirichlet document-topic distribution, η: topicword distribution. Assume K topics 2) β: a K×V matrix (V is the number of words in the vocabulary) Each βk is a distribution over the vocabulary. 3) The topic proportions for the dth document are θd. θd,k is the topic proportion for topic k in the dth document. 4) The topic assignments for the dth document are zd. zd,n is the topic assignment for the nth word in the dth document. 5) Finally, the observed words for document d are wd. wd,n is the nth word in document d, which is an element from the fixed vocabulary.
Concept of Topic Models Generative process: 1. Each topic k, draw βk~Dir(η); 2. Given the dth document d in the corpus D, draw θd~Dir(α). 3. For the nth word in the document wd,n, (a) Draw zd,n~Mult(θd); (b) Draw wd,n~Mult(βzd,n). Dir(·) is the Dirichlet distribution and Mult(·) is the multinomial distribution.
Topic Modeling A cell represents a specific mobility pattern and the numbers in the cell denote the occurrences of the pattern on average the mobility that went to r1 from rj in time bin tk occurred 5 times per day Analogy between mobility patterns and words based on Transition cuboid
Topic Modeling A POI is recorded with a tuple (in a POI database) consisting of a POI category name and a geo-position (latitude, longitude).
Topic Modeling For each formal region r, the number of POIs in each POI category can be counted. The frequency density vi of the ith POI category in r is calculated by POI feature vector of r is denoted by (Where F is the number of POI categories and the last “1” is a default feature to account for the mean value of each topic)
The DMR-based topic model The region topics are products of both the POIs and mobility patterns. In order to combine the information from both of them, we utilize a more advanced topic model based on LDA and Dirichlet Multinomial Regression (DMR)
TERRITORY IDENTIFICATION Region Aggregation This step aggregates similar formal regions in terms of region topic distributions by performing a clustering algorithm. We perform the k-means clustering method on the K-dimensional points θr,r ∈1,2,...,R. The number of clusters can be predefined according to the needs of an application or determined using the average silhouette value as the criterion.
TERRITORY IDENTIFICATION Functionality Intensity Estimation Intuitively, the number of visits implicitly reflects the popularity of a certain functional region. In other words, people’s mobility patterns imply the functionality intensity. As a result, we feed the origin and destination of each mobility (represented by latitude and longitude) into a Kernel Density Estimation (KDE) model to infer the functionality intensity in a functional region.
TERRITORY IDENTIFICATION Region Annotation In this step, given the results we obtained, we try to annotate each cluster of regions with some semantic terms, which could contribute to the understanding of its real functions.
Evaluation We use the following datasets for the evaluation: a)POI Data: Two Beijing POI datasets in year 2010 and 2011. b)Mobility Data: Two GPS trajectory datasets generated by Beijing taxis in 2010 and 2011
Evaluation We compare our method with two baselines: • The (term frequency-inverse document frequency) TF-IDF-based Clustering, which solely uses the POI data. • LDA-based Topic Model, which uses only the mobility data.
Functional regions discovered by different methods (1) Region B is an university, which should be clustered with region A(another university) and region D (a high school). Meanwhile, region F (theForbidden City) is not distinguished from other commercial areas like region E(Xidan). (2) DRoF outperforms LDA Region F in (b) is a developing commercial/entertainment area in Wangjing area. But LDA aggregates it with the Forbidden City (Region F in (a)), which is a region of historical interests; Area B(China Agricultural University) and Area E(Tsinghua University) are typical science and education areas where LDA fails to correctly cluster them together
Region Annotation: Diplomatic and embassy areas[c0] Education and science areas[c2] Developed residential areas[c6] Emerging residential areas[c8] Developed commercial/entertainment areas[c5] Developing commercial/business/entertainment areas[c1] Regions under construction[c7] Areas of historic interests[c4] Nature and parks[c3]
(1)Transition of c6 and c8 (2)Transition of c3 and c4 (3)The east area of Forbidden City in 2010 and 2011
Thank you! Q&A