Download
1 / 48
480 likes | 721 Vues
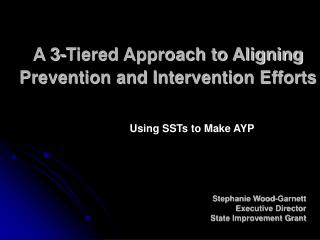
A 3-Tiered Approach to Aligning Prevention and Intervention Efforts. Using SSTs to Make AYP. Stephanie Wood-Garnett Executive Director State Improvement Grant. PURPOSE. Develop a common foundation for discussing evidence-based intervention Discuss intervention/prevention research

E N D
A 3-Tiered Approach to Aligning Prevention and Intervention Efforts Using SSTs to Make AYP Stephanie Wood-Garnett Executive Director State Improvement Grant
PURPOSE • Develop a common foundation for discussing evidence-based intervention • Discuss intervention/prevention research • Review and discuss the Student Support Team (SST) process
OUR GOAL: LEAVE NO CHILD BEHIND • Schools must have strong systems focused on proactive and preventative strategies designed to meet the needs of a diverse student population. • Classrooms and non-classroom settings need to be places where a range of student abilities are supported.
Use the SST Process to Help More Students Acquire the Target Skills…
Tertiary Prevention: Specialized Individualized *Systems for Students with High-Risk Behavior Academics and Behaviors ~5% Secondary Prevention: Targeted Interventions *Systems for Students with At-Risk Behavior ~15% Primary Prevention: School-/Classroom- Wide Systems for All Students, Staff, & Settings ~80% of Students
Rosenfeld, 1989 School Environment Instructional Level Student Instruction Curriculum Community Environment Home Environment
Lavar Arrington Darrell Green Dexter Manley
Tim Duncan Kobe Bryant Allen Iverson
Martha Stewart Oprah Winphrey Howard Stern
Academics % Green Zone % Yellow Zone % Red Zone Behavior % Green Zone % Yellow Zone % Red Zone What % of Your Students Are…
In Your School, What Do You Offer Kids Who Can’t/Won’t Do What You Need to Improve?
Reach Me Teach Me… Why Your Building Needs SSTs to Support School Improvement
Research Shows… All students regardless of socioeconomic status– need sustained support to succeed. James Comer, School Development Program, Yale University
Research Shows… • Studies indicate that for African American and Latino students, positive teacher-student relationships greatly impact student achievement (Baker, 1999; Lee, 1999; Slaughter-Defoe & Carlson, 1996).
Research Shows… “No significant learning occurs without a significant relationship” • James Comer • Yale University
Research Shows… • By high school, nearly 40-60% of all students are chronically disengaged from school (Klem and Connell, 2004).
Research Shows… • Students who are connected to school are less likely to: • Use substances • Exhibit emotional distress • Demonstrate deviant/destructive behavior • Experience suicidal thoughts/attempt suicide • Become pregnant • Skip school • Engage in bullying/fighting/vandalism • (Lonczak, Abbot, Hawkins, Kosterman & Catalano, 2002; Samdal, Nutbeam, Wold & Kannas, 1998; Schapps, 2003; Wilson & Elliott, 2003).
Research Shows… • In order to increase school-student connections: • Implement high standards • Provide academic supports to all students • Implement fair/consistent discipline policies • Create trusting relationships (in-school and school-home) • Support teachers in using new instructional strategies and implementing classroom management • Foster high parent/family expectations • Ensure that students feel close to at least one adult in the school building • Center for Disease Control and Prevention, Division of Adolescent and School Health &University of MN, 2003)
Every Child a Reader by Third Grade A vision or a reality?
Research Shows… • Rate of reading failure for African Americans, Hispanics, limited English speakers, and poor children ranges is 60% (70% in urban areas). National Institute of Child Health and Human Development
Research Shows… • Approximately 50% of children and adolescents with a history of substance abuse have reading problems.
Research Shows… • Almost seven thousand students drop out of high school every school day (Alliance for Excellent Education, 2006). • Of the children who will eventually drop out of school, >75% report reading difficulties (National Institute of Child Health and Human Development) • The students lack the literacy skills to keep up with the high school curriculum (Kamil, 2003; Snow & Biancarosa, 2003).
Research Shows… • The bulk of older struggling readers and writers can read, but cannot understand what they read (Alliance for Excellent Education, 2006).
2005 NAEP Grade 4 Readingby Race/Ethnicity, Nation Source: National Center for Education Statistics, NAEP Data Explorer, http://nces.ed.gov/nationsreportcard/nde/
2005 NAEP Grade 4 Readingby Family Income, Nation Source: National Center for Education Statistics, NAEP Data Explorer, http://nces.ed.gov/nationsreportcard/nde/
2005 NAEP Grade 8 Mathby Race/Ethnicity, Nation Source: National Center for Education Statistics, NAEP Data Explorer, http://nces.ed.gov/nationsreportcard/nde/
2005 NAEP Grade 8 Mathby Family Income, Nation Source: National Center for Education Statistics, NAEP Data Explorer, http://nces.ed.gov/nationsreportcard/nde/
Students who remain in school but continue to struggle are often placed in a variety of educational programs
Special Education Referrals • Academic problems (primarily reading deficiencies) • Behavioral problems Donovan & Cross, 2002; Learning Disabilities Association of America, 1996; Ysseldyke, Vanderwood & Shriner, 1997)
INDIVIDUALS WITH DISABILITIES EDUCATION IMPROVEMENT ACT (2004) • Reflects heightened intensity that we must do morebefore referring children to special education.
IDEA 2004 • In making a determination of eligibility under Section 614(b)(4)(A) of IDEA: • a child shall not be determined to be a child with a disability if the determinant factor for such determination is lack of appropriate instruction in reading, including in the essential components of reading instruction (as defined in Section 1208(3) of ESEA); lack of instruction in math; or limited English proficiency. [614(b)(5) of IDEA].
INTERVENTION “IDEA”S • Response to Intervention (RTI) • Early Intervening Services (EIS) • Disproportionality
AFRICAN AMERICAN STUDENTS IN SPECIAL EDUCATION • African American students: • 2.9 times as likely to be labeled mentally retarded (MR) • 1.9 times as likely to labeled seriously emotionally disturbed (SED) • 1.3 times as likely to be labeled as having a learning disability (LD) U.S. Department of Education, Office of Special Education Programs (2000)
BOYS OVER-REPRESENTED • 1.9 million girls and 3.8 million boys are classified as special education (U.S. Department of Education, Office for Civil Rights, 2000) • Boys dominate the emotionally disturbed category: • 90% in Kansas City • 55% in Milwaukee • 76% in Washington, DC
TEAM Together Everybody Achieves More…
SST Teams PBIS Teams Discipline Teams
SSTs: 30 YEARS IN THE MAKING • Began as a special education mandate in the 1975 Education for all Handicapped Children Act which required the use of multidisciplinary teams in the referral/placement process (Rosenfeld & Gravois, 1999). • The function and purpose of SSTs changed as schools and families discovered the benefits of intervening earlier for students. By 1979 Chalfant and colleagues developed Teacher Assistance Teams (Safran,1996). • Currently most states require some form of intervention prior to special education referral: • 69% of states mandate prereferral intervention teams • 86% of states require or recommend pre-referral intervention teams (Truscott, Cohen, Sams, Sanborn & Frank, 2005)
IMPACT OF EFFECTIVE SSTS • Improve academic achievement • Improve student behavior (including school attendance) • Improve school-parental communication and relationships • Increase collaboration in schools • Reduce referrals to special education
PURPOSE AND FUNCTION OF SSTS • SST is not to “operate as a special education eligibility or placement committee” (NABSE and ILIAD Project, 2002, p. 19). • SST is NOT meant to deny services to students who may actually have a disability. • SSTs should NOT assume the difficulty lies solely within the child.
SST PROCEDURES • Individual interventions • Group interventions • Meeting occurrence (frequency/duration) • Variations in implementation • Elementary school • Middle/Junior High school • High school
Use data in all discussions Establish positive student goals Align interventions with the desired results Review student progress regularly Set measurable outcomes Include evaluation measures SST PROCEDURES
CONTACT INFORMATION • Stephanie Wood-Garnett • Executive Director, State Improvement Grant • District of Columbia Public Schools • www.dcsig.org • Stephanie.Garnett@k12.dc.us • 202-442-5539