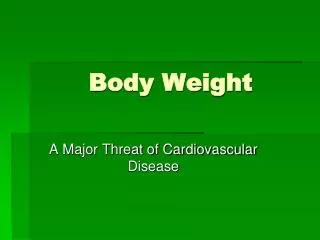
OPTIMAL BODY WEIGHT FOR PERFORMANCE
C HAPTER 15. C HAPTER 15. OPTIMAL BODY WEIGHT FOR PERFORMANCE. OPTIMAL BODY WEIGHT FOR PERFORMANCE. Body build is the form or structure of the body. w Muscularity. w Linearity. w Fatness. Body composition refers to the chemical composition of the body. w Fat mass.

OPTIMAL BODY WEIGHT FOR PERFORMANCE
E N D
Presentation Transcript
CHAPTER 15 CHAPTER 15 OPTIMAL BODY WEIGHTFOR PERFORMANCE OPTIMAL BODY WEIGHTFOR PERFORMANCE
Body build is the form or structure of the body. w Muscularity w Linearity w Fatness Body composition refers to the chemical composition of the body. w Fat mass w Fat-free mass Body Build, Size, and Composition Body sizeis determined by height and weight.
Did You Know…? Fat-free mass is composed of all of the body's nonfat tissue including bone, muscle, organs, and connective tissue. Lean body mass includes all fat-free mass along with essential fat. Lean body mass is difficult to measure so the fat mass/fat-free mass model is most often used.
Did You Know…? Body composition is a better indicator of fitness than body size and weight. Being overfat (not necessarily overweight) has a negative impact on athletic performance. Standard height-weight tables do not provide accurate estimates of what an athlete should weigh because they do not take into account the composition of the weight. An athlete can be overweight according to these tables yet have very little body fat.
Essential Fat • All fat is not bad!! • We need fat for padding of organs, insulation, energy source • There is a minimum amount that we need to function daily = essential fat • Gender specific • males ~ 3% • females ~ 7%
Essential Fat • Why the differences? • A male at 7% is like a female at 17% • Women are more complicated!! • Women have babies, menstrual cycles, etc… and need more fat for the survival of the species
Assessing Body Composition w Densitometry (hydrostatic weighing) w Skinfold fat thickness w Bioelectric impedance w Infrared interactance
Densitometry w Body density = Body mass Body volume w Body mass = measured on a regular scale w Body volume = measured using hydrostatic (underwater) weighing accounting for water density and air trapped in lungs w % body fat = (495 ÷ body density) – 450
UWW • Body Density = BW÷((BW-UWW)/H20 Density) - RV-0.1
Residual Volume • Cannot blow all of the air out of your lungs (that would be bad!!) • We need to account for the air that is left in the lungs (RV) + the air in the GI (~0.1L)
Determining RV • Prediction equations based on height and/or Vital Capacity • Male = 0.24 x VC • Female = 0.28 x VC • Male = 0.019(Ht cm)+0.0115(age)-2.24 • Female = 0.023(Ht cm)+0.021(age)-2.978 • Nitrogen Analysis (rebreathing apparatus)
Procedures • 1. Wear light clothing (swimsuit) • 2. Use bathroom prior to weighing • 3. Calibrate scale • 4. Weight the chair or seat and equipment • 5. Measure water temp • 6. Remove all air from clothing
Procedures • 7. Sit in seat • 8. Submerge • 9. Blow all air out of lungs and remain still • 10. 3-10 trials; average of the highest three • 11. Subtract weight of apparatus from average UWW
Did You Know…? Inaccuracies in densitometry are due to variation in the density of the fat-free mass from one individual to another. Age, sex, and race affect the density of fat-free mass.
Skinfolds • Measurement of subcutaneous adipose tissue at specific anatomical sites • BD or %fat is obtained with the use of equations (either population specific or generalized)
SF Procedures • Take all measurements on the right side of the body • Identify and mark site • Grasp skin and fat between thumb and index finger 1cm above marked site • Continue grasping at the site while taking the measurement
SF Procedures • Place the jaws of the caliper perpendicular to the fold and slowly release the pressure • Take the measurement 4 seconds after pressure is released • Read the dial of the nearest 0.1mm (Harpenden or Holtain), 0.5mm (Lange), or 1mm (plastic)
SF Procedures • Take at least 2 non-consecutive measurements - if values vary by +10% take additional measurements • No measurements directly after exercise • Reliability should be 0.95 or greater
Sites • Chest • Subscapular • Midaxillary • Suprailiac • Abdominal • Triceps • Biceps • Thigh • Calf
Equations • Jackson’s 3-site • Males - BD=1.10938-0.0008267(sum3)+0.0000016(sum3)2-0.0002574(age) • chest, abdomen, thigh • Females - BD=1.0994921-0.0009929(sum3)+0.0000023(sum3)2-0.0001392(age) • triceps, suprailiac, thigh
BIA • Based on the premise that fat-free tissue is a better conductor of an electrical current (contains water and electrolytes) than fat tissue • The resistance to current flow is inversely related to FFM
BIA • Abstain from eating or drinking for 4 hours prior • No exercise 12 hours prior • No alcohol 48 hours prior • No diuretics (caffeine) prior to assessment
Equations • Each machine has its own equation (developed by the manufacturer and is proprietary) • %fat = 4.57 ÷ (1.1411 - ((BW * Resistance) ÷ Ht2)) - 4.142 * 100 • ht = length of the conductor
BIA Reseach Equations • Population-specific equations have been developed through research • Used for children, different races, different ages etc… (p. 161) • May have better accuracy than machine equations
Advantages • Non-invasive • Safe • Easy to administer • Accurate on some populations • Field technique
Advantages • More costly than SF calipers • Many studies have begun to cross-validate (just because the equation worked on the researchers population doesn’t mean it will work on others) • Beginning to develop specific equations • get resistance value from machine and enter into a specific equation
Disadvantage • The accuracy has been questioned: • Skinfolds 2.4 % error • BIA 5% error • Visual 3.1% error • Race cannot be entered into the machine • Children distribute water differently than adults
DEXA • 3 component model • bone, fat, fat-free mass • assesses total bone mineral content • usually found in a clinical setting
Advantages • Accurate • Measurement of bone content (osteoporosis) • safe • rapid • minimal subject cooperation (just lay there)
Disadvantage • Costly • Limited Access
NIR • Based on the premise that the degree of infrared light absorption is related to the composition of the substance through which light passes • Fat and Fat-Free Mass absorb and reflect light differently
NIR • Emit infrared light at wavelengths of 940-950 nm into a body part (ie., biceps) and measures the intensity of the re-emitted light • More specific equations/machines are necessary
Advantages • Non-invasive • Safe • Easy to administer • Field technique
Disadvantages • Cost? Is it worth it? • Few Age/Gender Specific Equations • Accurate? • Futrex 5000 3.1-4.2% • Futrex 5000A 6.3% • Futrex 1000 4.8-6.3% • Sum 3 2.4-3.6 • BIA 5.0-7.1%
Body Mass Index (BMI) • Ratio of a person’s weight (kg) to the height squared (m2) • Used to categorize people with respect to their degree of obesity • Not used to determine % fat
BMI • 20-25 kg/m2 - desirable • 25-29.9 kg/m2 - overweight • >30.0 - obesity
Waist to Hip Ratio • Indication of the pattern of body fat distribution • Indicator of the health risks of obesity • excess trunk fat - increased risk of hypertension, type 2 diabetes, high cholesterol, CAD, premature death
Waist to Hip Ratio • Risks increase with increasing ratios • very high risk >0.94 young men and 0.82 young women • very high risk >1.03 older (60-69 years) men and 0.90 for older women
Measurements • Made with a tape measure • Waist - at the level of the umbilicus • Hips - biggest part of the gluteals
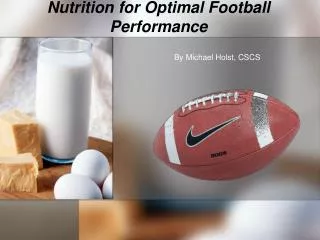
Maximizing fat-free mass w Desirable for strength, power, and muscular endurance w Undesirable for endurance or jumping sports if result is a gain in weight Minimizing relative body fat w Desirable, especially in sports in which the body weight is moved through space w Improves speed, endurance, balance, agility, and jumping ability Body Composition and Performance
Risks With Severe Weight Loss w Dehydration w Chronic fatigue w Disordered eating and eating disorders w Menstrual dysfunction w Bone mineral disorders
Appropriate Weight Guidelines w Maximize performance within the specific sport w Are based on body composition w Emphasize relative body fat rather than total body mass w Use a range of relative fat values that are considered acceptable for the athlete’s age and sex
Achieving Optimal Weight w Combine proper diet with exercise. w Lose no more than 0.5 to 1.0 kg (1 to 2 lb) per week. w Reduce caloric intake to 200 to 500 kcal less than daily energy expenditure. w Use moderate resistance and endurance training.
Calculations for Optimal BW • 1. Determine % fat • 2. Calculate Fat Weight • BW * %fat ÷ 100 • 3. Calculate Fat-Free Weight • BW - FW • 4. Calculate Desirable Weight • FFW ÷ (1- (desired %fat ÷ 100))
Calculations • 5. Calculate amount of weight that needs to be lost • BW - Desirable Weight • 6. Calculate kcal deficit • 3500 kcal per pound of weight needed to be lost • 7. Assuming loss of 1 pound (3500 kcals) per week, calculate # weeks to reach goal