Download

1 / 14
140 likes | 273 Vues
Dive into the robust methodologies employed at the University of North Carolina at Chapel Hill's DiRT Lab for network trace collection and analysis. This overview covers monitoring locations, infrastructure setups, process sequences, and live demonstrations of traffic capture using advanced tools like DAG cards and tcpdump. Gain insights into post-processing techniques, anonymization methods, and statistical analysis of network data, including throughput plots and round trip time calculations. Explore how these practices support experimental infrastructure and enable rigorous testing across varied scenarios.

E N D
The UNIVERSITY of NORTH CAROLINAat CHAPEL HILL Trace collection in the UNC-CH DiRT lab
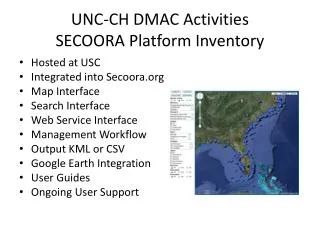
Outline • Monitoring location and UNC network • Setup specs - infrastructure • Process sequence overview • Live demo • Post-processing • Our experimental infrastructure and its capabilities
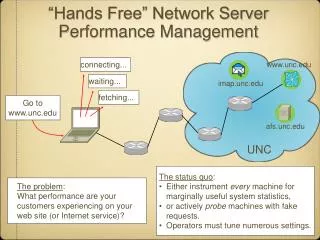
Trace collection point UNC-CH network Internet & Internet2 Monitor w/ DAG card
Infrastructure • Monitor specs: P4 1.8 GHz CPU, 1.4 GB RAM, 5*32GB hard drives, FreeBSD 4.7. • DAG 4.3GE dual interface 1000Base-SX Gigabit Ethernet 133MHz PCI-X card.
Process sequence overview convert to tcpdump format using dagconvert packet capture using dagsnap anonymize using tcpdpriv create connection vectors in tmix run (100s of) tmix experiments in the lab analyze and present results
Demo • /usr/local/bin/dagsnap -d /dev/dag0 -s 300 -v -o test.dag • dagconvert -Terf:pcap -i ../test.dag -f b > test.b.tcpdump • dagconvert -Terf:pcap -i ../test.dag -f a > test.a.tcpdump • /usr/dirt/src/tcpdpriv-1.1.10/tcpdpriv -P99 -A60 -M20 -t mapping_file -r test.a.tcpdump -w test.a.anon.tcpdump • /usr/dirt/bin/4.x/tcpdump-hiperf -I -S -n -tt -r test.a.anon.tcpdump tcp > test.a.anon.tcpdump.txt(-I Print IP header fields (ttl, id and length))
Packet capture • Usage: dagsnap [options] • -d <device> DAG device name • -h display help (this page) • -j Maximize disk write performance - will only write in chunks • -m <mebibytes> Maximum amount of data to write per call in MiB (default 4) • -o <filename> output file name (default is stdout) • -s <seconds> runtime in seconds • -v increase verbosity • With -v three columns are printed per second. • 1. The cumulative total of data written out. • 2. The buffer occupancy. Small values indicate no packet loss. • 3. The rate at which data is currently being written.
Convert dag to tcpdump • dagconvert: DAG file conversion utility: Usage: dagconvert [options] • -d <device> DAG device name • -h display help (this page) • -v increase verbosity • -i <filename> input file • -o <filename> output file • -r N[k|m|g] change output file after N Bytes. • k, m, g suffixes for kilobytes, megabytes, gigabytes. • -s <snaplen> output snap length • -t <seconds> capture period in seconds • -T <in_type:out_type> input and output types (see list of types below) • -f <list> comma separated list of filters (see list of filters below)
anonymize • usage: /usr/dirt/src/tcpdpriv-1.1.10/tcpdpriv • P99 – pass TCP port numbers through unchanged • A60 – map address using mapping file • M20 – option for multicast addresses
Example plot – throughput (Mbps) • A 10-min trace collected at low-usage time (2:30am)
Analysis • Simple statistics like throughput plots over time • Loss rates • RTT (round trip time) calculations • Running tmix experiments with the data • analyze results • create various possible scenarios and test (e.g. what does doubling the traffic throughput do to end user response times?)
… … Access router & control station NFS servers arp proxy Network Topology Monitors Ethernet Switch Ethernet Switch Router Router End systems End systems
Tmix discussion • Replay trace on the network in a controlled environment • Throughput can be varied up or down • Induce losses and delays per flow • Replaying a-b-t sequences