Forest-Atmosphere Exchange Processes: Boundary Layer Studies and Subcanopy Flows
Investigating subcanopy flows and boundary layer budget studies for CO2 flux in forest-atmosphere exchange processes.

Forest-Atmosphere Exchange Processes: Boundary Layer Studies and Subcanopy Flows
E N D
Presentation Transcript
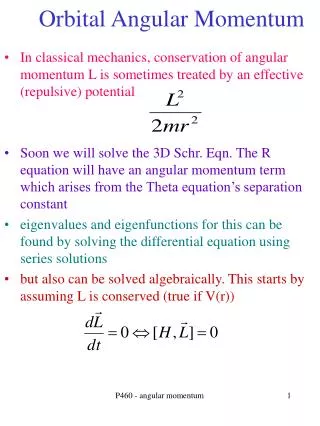
Region Mean n Mean n AGU, December 2001 NE, NY -5.2 ± 0.9 85 -6.6 ± 0.6 236 PA, NJ 1.0 ± 1.6 36 1.6 ± 0.7 130 VA 4.8 ± 4.9 26 -5.0 ± 1.6 112 Forest-Atmosphere Exchange Processes David Fitzjarrald, Ralf Staebler, Matt Czikowsky, Ricardo Sakai, Sasha Tsoyref Atmospheric Sciences Research Center, University at Albany, SUNY, NY 1. Subcanopy Flows and Advection of CO2 The traditional eddy covariance flux technique, as used at over 140 FluxNet stations worldwide, has problems capturing respired CO2 on calm nights. It has been speculated that this may be due to subcanopy “drainage flows”, transporting CO2 horizontally away from the site. Since 1999, we have been developing and optimizing a methodology to characterize subcanopy flows and to directly measure horizontal advection. 3. Boundary Layer Budget Studies 2. Forest Phenology and Streamflow We hypothesize that the greatly enhanced growing season ET by ‘robbing’ streams of runoff provide a phenological indicator. We identify three independent runoff characteristics that accompany spring onset and leaf emergence. These are the return of the P-R curve to pre-snowmelt pulse values, the streamflow recession time constant for return to baseflow, and the amplitude of the diurnal streamflow signal. Replacing pasture with forest alters the long-term water balance in an analogous manner, but reforestation effects on observed runoff are subtle. Experiment layout. Shown is a 6 minute average on the night of DOY 292 (Sept 10) at 22:45EDT, of the wind vectors at the 9 sonic anemometer locations, an interpolated [CO2] field based on measurements at 9 points around the perimeter and in the center of the diamond. The inset shows the simultaneous CO2 profile. The three tower anemometers are labeled by their height above ground. Wind roses at 1.8m above ground as a function of the fraction of buoyancy forcing (term 5 in the momentum equation). The last panel shows a 4km x 4km map centered on the EMS tower; the solid lines indicate up-slopes, the dashed lines down-slopes, and the length shows the distance to the next hilltop or valley bottom. When buoyant forcing dominates (i.e. drainage flows are most likely), the flow comes either from NW or N, the directions of the longest continuous downward slopes. Average diurnal time-height section from the NOAA profiler at Orange Airport, 2002. Top panel: Color code is wind speed (m/s) along with wind barbs. Bottom panel: Signal/noise ratio. Solid line is the median LCL derived from the ASOS surface temperature and humidity station at Orange airport. Symbol “C” illustrates the median height of the lowest cloud base from the ASOS ceilometer. All data were included for the indicated period. Mean streamflow recession time constant for Wappinger Creek, NY (left) and East Branch Swift River, Hardwick, MA (right) for early (solid) and late (dashed) 20th-C. periods. The mid-to-late growing season streamflow recession time constant decreases in the 1970-2000 period for Wappinger Creek, presumably due to increased ET by the successional forest growth. The recessions for the Swift River in the mid-to-late growing season are slightly longer for the 1970-2000 period, presumably due to decreased transpiration by an older forest. The momentum equation: [1] [2] [3] [4] [5] [6] [7] [1] acceleration [4] vertical stress divergence [2] horizontal advection of momentum [5] buoyant forcing [3] vertical advection of momentum [6] pressure forcing [7] canopy drag The conservation equation for CO2: [1] [2] [3] [4] [5] [6] [1] storage [2] horizontal mean transport (advection), east-west [3] horizontal mean transport (advection), north-south [4] vertical mean transport [5] vertical eddy transport at height h [6] sum of all sources and sinks Watershed area (Aw) vs. diurnal streamflow signal time fraction (solid line).The diurnal streamflow signal time fraction is defined as the fraction of time the diurnal streamflow amplitude exceeds 2 percent of the total streamflow. The dashed curves represent the power-law relationship between watershed area and streamflow amplitude, .Labels above the curves denote values from 0.5 to 0.8. Total stream length L was previously found to scale to watershed area (0.5). Hypothesizing that the riparian area Ar has approximately constant width, Ar~L, increased riparian area fraction in small watersheds contributes to the greater likelihood of the diurnal streamflow signal being observed there. Diurnal average from the sodar at Harvard Forest, 2002. Top panel: Color code is wind speed (m/s) along with wind barbs. Center panel: Color code is acoustic echo intensity; contours show average sw (cm/s). Bottom panel: Sodar-derived friction velocity (cm/s). Color code legends are at right. The Draino CO2 box (horizontal gradients) 1970/2000 – 1928/1958 1976/2000 – 1951/1975 The central 5m mast (CO2, H2O and T profile, Draino Box) Hourly means of all the measured CO2 budget terms for the whole observational period, 2002. Positive values indicate fluxes out of the control volume. Adding the horizontal advection terms increases our estimate of respiration, slightly more than applying the “u* correction” does (i.e. replacing flux estimates during calm conditions with u* < 0.2 ms-1 with estimates based on soil temperature). Spring onset date change (right) estimated from the P-R method (left). We observe a trend towards an earlier spring in the New England/New York region, with very little change in the PA/NJ region. We note the presence of an anomaly in Virginia, with a later spring date of about 4 days seen in the late – early 20th C. difference. This is not seen in the late – mid 20th C. difference. Rough estimate of the CO2 flux using Boundary Layer methods (i.e. the flux is equal to the product of the rate of change of the concentration (at 30m) and the boundary layer (h dc/dt). Top panel: CO2 concentration at 30m. Bottom panel: Eddy flux at 30m (connected dots), and the BL accumulation estimate (solid line). The sodar on top of the new 26m scaffold tower Comparison run of all subcanopy sonics Across the top: Panorama photo of Harvard Forest from the new scaffold tower. Prospect Hill is repeated at the beginning and end. Across the bottom: Panorama photo of the subcanopy, near the boardwalk to the EMS hut. Below it: Horizontal scan of understory obstructions using a laser range finder.