Download
1 / 38
380 likes | 525 Vues
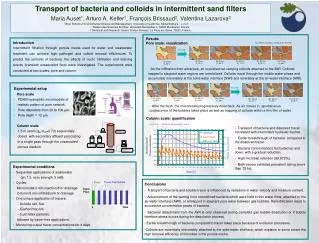
Transport of bacteria and colloids in intermittent sand filters. Maria Auset, Arturo A. Keller, Francois Brissaud and Valentina Lazarova. Bren School of Environmental Science and Management, University of California, Santa Barbara. University of Montpellier II, France.

E N D
Transport of bacteria and colloids in intermittent sand filters Maria Auset, Arturo A. Keller, Francois Brissaud and Valentina Lazarova Bren School of Environmental Science and Management, University of California, Santa Barbara University of Montpellier II, France 229th ACS San Diego National Meeting
Contaminated Water Supply ? Sewer line or Septic tank Vadose Zone Saturated Zone • Contaminants • Viruses • Bacteria Water Cycles of household water use → Transient unsaturated flow Air Sand grain
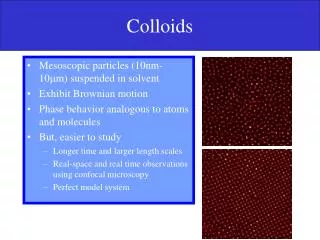
Air Attached Inactivated Water Inactivated Inactivated Attached Solid Fate and Transport of Colloids Attached V Suspended Suspended
Objective Investigate the effects of cyclic infiltration and draining events (transient unsaturated flow) on microorganism transport, in order to help predict removal of pathogenic bacteria in sand filters and natural porous media.
Experimental setup Pore scale PDMS hydrophilic micromodels of realistic pattern of pore network. Pore diameters from 20 to 100 μm. Pore depth = 12 μm. Column scale 1.5 m sand (d60/d10=2.72) sequentially dosed with secondary effluent percolating in a single pass through the unsaturated porous medium. 200 μm 1.5 m
Flushes Input Flow Time 0 Traced flush Tracer-free flushes Input Flow Time 0 Experimental conditions • Unsteady flow: Sequential applications of wastewater • Cycles: Micromodel:2 min injection/8 hr drainage Column:5 min infiltration/4 hr drainage • One unique application of tracers: - Soluble salt, NaI. - Escherichia coli, - 5 μm latex particles, followed by tracer-free applications. • Monitoring output tracer concentrations for 4 days.
Direction of flow Water Content: 41% Solid Water Air
First Flush 12 sec after flush
Water Content: 76% 26 sec after flush
Water Content: 78% 38 sec after flush
Water Content:78% 51 sec after flush
Water Content: 79% 1 min 04 sec after flush
Water Content: 80% 1min 12 sec after flush
Water Content: 82% 1min 28 sec after flush
Water Content: 83% 1min 39 sec after flush
Water Content: 83% 1min 55 sec after flush
Water Content: 84% 10 min 09 sec after flush
Water Content: 68% 2 h 59 min after flush
Water Content: 58% 3 h 49 min after flush
Water Content: 55% 4 h 08 min after flush
Water Content: 47% 4 h 51 min after flush
Water Content: 43% 5 h 04 min after flush
Second Flush 11 sec after flush
Water Content: 77% 23 sec after flush
Water Content: 79% 1 min after flush
Water Content: 80% 1 min 18 sec after flush
Water Content: 82% 1 min 35 sec after flush
Water Content: 83% 2 min after flush
Water Content: 85% 2 min 28 sec after flush
Water Content: 87% 5 min 49 sec after flush
Key Findings • Sorption onto AWI and SWI is “irreversible”. • Colloids trapped in thin water films. • Colloids sorbed onto AWI can be transported • Along with the moving air bubble • As colloidal clusters • As water is remobilized
Unsaturated column setup Pressure transducer Pump Data Acquisition System Bacteria suspension Wastewater solution Flowmeter Traced flush Tracer-free flushes Epi-fluorescent microscopy Input Flow Time 0
Key findings • Transport of bacteria and tracer is influenced by variations in water velocity and moisture content. • Advancement of the wetting front remobilizes bacteria either attached to the AWI or entrapped in stagnant pore water between gas bubbles leading to successive concentration peaks of bacteria in the effluent. • Microbial retention rate was high, 99.972 %. • Retention is due to reversible bacteria entrapment in stagnant regions and sorption onto the AWI and irreversible attachment onto SWI.