Solving Sequences
Learn to solve sequence problems using spreadsheets, analyzing everyday life patterns, from population growth to bouncing balls. Practice both recursive and explicit formulas to understand sequences visually.

Solving Sequences
E N D
Presentation Transcript
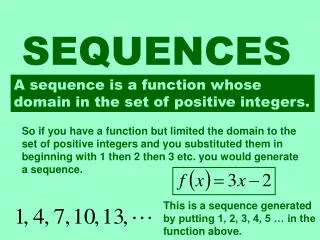
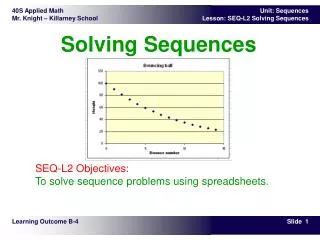
Solving Sequences SEQ-L2 Objectives:To solve sequence problems using spreadsheets. Learning Outcome B-4
In the previous lesson, a sequence was described as a list of numbers that increase or decrease in size according to a pattern. In this lesson, we will study number patterns that occur around us in everyday life. For example, if we invest money regularly, the year-end balances may be a geometric sequence. The depreciation of a car's value over time follows a pattern. The amount of medication, caffeine, or alcohol eliminated by our bodies over time follows a predictable pattern.In this lesson, you will solve problems by writing and analyzing sequences on a spreadsheet.The graph shows twosequences that may help Rudydecide whether it's time to thinkabout buying a new car. Theory – Intro
A group of 100 astronauts is sent to Mars to colonize the planet. NASA scientists have predicted that the population will increase by 12 percent every 20 years. The spreadsheet for the first 100 years is shown. • Write a recursive formula for cell B3. • Write an explicit formula for cell B3. • Use the spreadsheet graphing function to draw a graph of the sequence of populations. Describe the shape of the graph. • Solution: • The recursive formula in B3 could be: = B2 * 1.12 • The explicit formula in cell B3 could be: = 100* 1.12 ^ (A3/20) • The graph appears to be linear (next slide). Example – Recursive and Explicit Formulas & Graphs
Expand the spreadsheet from the previous page to determine the expected population in 300 years. Does the graph still look the same as it did before? Example – Recursive and Explicit Formulas & Graphs
The population after 300 years is 547 people, and the graph is distinctly curved upwards, which means the sequence is diverging.Sometimes you need to extend a sequence on spreadsheet to see the pattern of the sequence. The 'Fill Down' feature of spreadsheet makes this operation quick and easy to do. Also, it is often easier to see the pattern from the graph than from the list of numbers. Example – Recursive and Explicit Formulas & Graphs
A 'Super Bouncer' sold locally is guaranteed to bounce to 90 percent of its drop height if it is dropped onto concrete from a height of less than two metres.The spreadsheet below shows the number of bounces, the bounce heights, and the total distance the ball has traveled. Example – Super Bouncer
Use the spreadsheet to answer the following questions. • How high does the ball bounce on its eighth bounce? • How many times does the ball bounce before it rises to less than half of its original drop height? • How many times does the ball bounce before it stops bouncing? • How far has the ball traveled as it reaches the top of its 10th bounce. • Create a spreadsheet graph that shows the bounce height versus bounce number. • We need to fill down the spreadsheet columns to at least row 12 to answer the questions. A completed spreadsheet and graph are shown on the next slide as the answer for #5. Example – Super Bouncer
Answers: • Height on the eighth bounce is 43.0 cm. • The ball bounces six times to at least 50 cm. • According to this model, the ball never stops bouncing. This is a mathematical explanation of bouncing behaviour, and does not describe it exactly. • Total distance traveled at the top of the 10th bounce is 1237.5 cm. Example – Super Bouncer
A young man invested $10,000 at 10 percent compounded annually when he turned 18. A young lady invested $1000 when she turned 18, and she continued to invest $1000 per year on her birthday for the next nine years (i.e., 10 consecutive investments of $1000 each). Both investments have an interest rate of 10 percent per annum compounded annually. • What is the value of each investment when they are 30? • What is the value of each investment when they are 55? • Note that the formulas change incolumn D after 10 years. Example – Saving Money
Answers:To find the answers, the spreadsheet above must be filled down to at least row 39. Parts of the spreadsheet are shown below. • At age 30, his investment is $31,384.28, and her investment is $21,212.71. • At age 55, his investment is $340,039.49 and her investment is $229,833.50. Example – Saving Money
The current population of a town in western Manitoba is 8000. The town administrator needs to predict the population of the town in 10 years. As he researches the population statistics for the town, he discovers that: • the birth rate is 3% per year. • there are on average 100 deaths per year • each year about 4% of the town's population moves away • each year about 450 people move into town • The administrator prepares the spreadsheet on the next slide to determine the population in 10 years. The spreadsheet is shown with numbers and with formulas. Example – Town Population
Note the formula in cell B3: • the net result of the birth rate (3%) and the people moving out (4%) is that 99%, or 0.99 of the people remain in town. • the net result of 100 deaths and 450 people moving in is '+350' people. • Therefore, the population of the town in 10 years is expected to be 10,582, or approximately 10,600. Example – Town Population
The town administrator shows his calculations to the members of the town council, but they do not understand his mathematics, and therefore they do not trust his population prediction. He then prepares another spreadsheet that everyone will hopefully understand. It is shown below. Note that the answer turns out exactly the same way, but the calculations are easier to follow by people that do not understand spreadsheet formulas. (Click for formulas) Example – Town Population
Anthony, a worker in a medical lab, has accidentally been exposed to bacteria that cause the disease anthrax. The treatment he uses is the antibiotic Cipro, which he must take every 12 hours. His body eliminates 75 percent of the medication in 12 hours. The level of medication in his body should be around 24 mg, and never higher than 36 mg. How many milligrams of Cipro should he take to maintain the proper level of medication in his body?To solve this problem, we can create the spreadsheet shown. The formula in cell B3 is:=B2 * 0.25 + $B$2where the number in cell B2 represents the number of mg of medication taken initially, 0.25 indicates that 25 percent of the medication remains in his body after 12 hours, and '$B$2' is the additional medication taken every 12 hours. We then use trial and error to determine the correct amount of medication. Example – Level of Medication
By experimenting with the values in cell B2, we arrive at the following chart, which indicates that the amount of medication taken each time should be 18 mg. Example – Level of Medication