Download
1 / 43
430 likes | 688 Vues
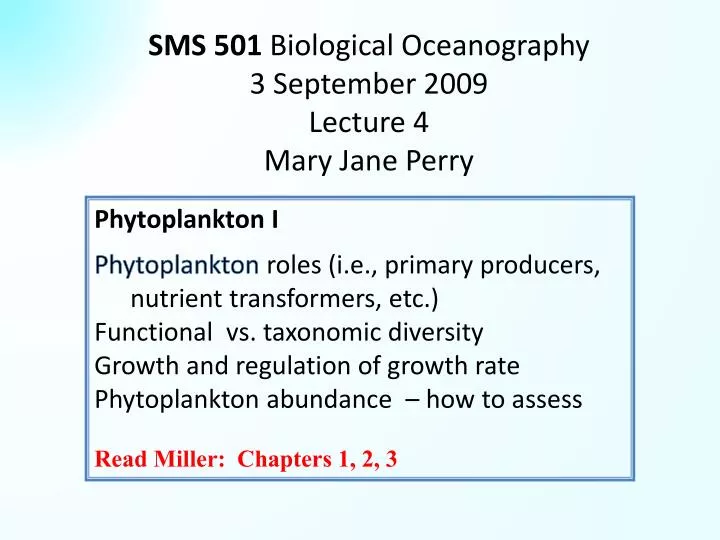
SMS 501 Biological Oceanography 3 September 2009 Lecture 4 Mary Jane Perry. Phytoplankton I Phytoplankton roles (i.e., primary producers, nutrient transformers, etc.) Functional vs. taxonomic diversity Growth and regulation of growth rate Phytoplankton abundance – how to assess

E N D
SMS 501 Biological Oceanography 3 September 2009Lecture 4Mary Jane Perry Phytoplankton I Phytoplankton roles (i.e., primary producers, nutrient transformers, etc.) Functional vs. taxonomic diversity Growth and regulation of growth ratePhytoplankton abundance – how to assess Read Miller: Chapters 1, 2, 3
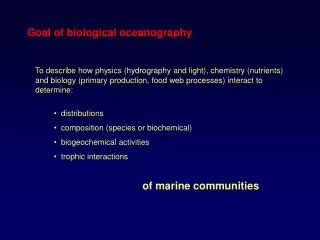
Roles of phytoplankton * primary producers -- transformers of energy and materials (use sunlight as energy and inorganic nutrients as raw materials to synthesize organic C) – carbon cycle from a biological perspective (photosynthesis, respiration) – regional and global patterns of primary production; changes in time? – abiotic controls on primary production (T, nutrients, light, etc.) – fate of carbon produced (predation, excretion of DOC, sinking)* diversity in the ocean – functional and taxonomic diversity concept of functional groups evolution – endosymbiosis and/or lateral gene transfer* requirements for specific elements – regulate abundance &/or taxa* environmental regulationby phytoplankton through uptake of CO2, production of DMS, localized heating, water clarity
Significant differences between marine and terrestrial systems Size – clearer relationship between size and trophic structure in marine realm. Growth rate of marine autotrophs is greater, as is rate of biomass turn over. Stoichiometry is different, with higher concentrations of N and P in marine autotrophs (C:N ratio of trees is > 20 due to more structural mass vs. ~ 6.5 for phytoplankton). Less carbon flow through detrital food webs in marine realm.
Phytoplankton basics* autotrophs (make their own food; but some are mixotrophic) & are responsible for ~50% global carbon fixation* lower C/N ratio than land plants (~6.5 C mol / N mol)* pigmented (to absorb light; taxonomic pigment diversity); pigmentation is also basis of their visibility from space* small (~1 mm to ~ 100 mm)* mostly one-celled (some chains; signaling w/in chains)* reproduce by binary fission– vegetative growth (but can have sex)* taxonomically diverse (2 kingdoms: prokaryotes & eukaryotes; great diversity w/in the eukaryotes ) * morphological diverse (cell coverings – cellulose, Si, CaCO3)
Concept of plankton functional types vs. species What’s important for “functional” typing ?size & shape ability to live in turbulent vs. stratified environment motility – acquire nutrients, encounter gametes, avoid predation role in carbon flux (‘ballasting’) – faster sinking w/ Si, CaCO3? nutrients – nutrient uptake, transport or sequestering mechanisms – nutrient ratios – special element cycling (N2-fixation; Si; CaCO3) nutritional value to higher trophic organisms – essential fatty acids – toxins, aldehydes & other alleopathic compounds what else ??
Historically, smaller cells most recently recognized Phytoplankton size (nomenclature historical); they are small net > 20µm nano < 20µm pico < 5µm ultra < 2µm (smallest are prokaryotes)consequences of size: small cells are mostly spherical while larger cells often have non-spherical morphology life in a viscous fluid (more in Week VI) diffusional uptake of nutrients (smaller cells) vs. storage exposure to light (packaging) and UV damage metabolic rates scale to size (specific rate decr. w/size)reduced sinking rate of small cells maximal number of cell per volume inverse to cell sizegrazing/ predation is typically size-specific export efficiency and phytoplankton size (microbial loop)
TREE of LIFEhttp://tolweb.org/tree/phylogeny.htmlEukaryotes:cells with internal organelles. Protista– paraphyletic group (60) consisting of those eukaryotes which are not animals, true fungi or green plants; includes phytoplankton and heterotrophic protozoa; green algae - protists or planta?Eubacteria: or "True bacteria”prokaryotes - no formal internal organelles (although this has been recently challenged), thought to be origin of mitochondria and chloroplasts in eukaryotes. Cyanobacteria – important players.Archaea – prokaryotesrecognized and as a distinct from bacteria ~ 20 yearsdistinct membrane lipids & DNA sequences (includes groups such as methanogens, halophiles, and thermacidophiles); photosynthetic?Viruses
Keeling et al. 2004, Science 306: 2191 Eukaryotic phytoplankton are a very diverse group! Origin of eukaryotes through primary, secondary or even tertiary endosymbiosis. Initially, endosymbionts were prokaryotes, but latter also eukaryotes.
Trichodesmium – nitrogen fixer; warm waters; patchy; role of Fe Prokaryotes Synechococcus ~ 1 mDiagnostic: phycoerthyrin pigment fluoresces orange (in contrast to chlorophyll, which fluoresces red) Prochlococcus ~ 0.7 mDiagnostic: very small size,lack of orange fluorescence,divinyl chlorophyll a & b
Diatoms are important in global carbon cycle. Key character is transparent external cell covering of amorphous silica[(SiO2)n (H2O)] – most likely evolved from scales Silica frustule (absolute requirement for Si), responsible for diminution in size; liquid-filled vacuole- nutrient storage and different volume to carbon ratio; role of Fe; pigments: chlorophyll a and c, fucoxanthin Two major groups: a) Centric (Centrales -- radially symmetric valves)b) Penates (Pennales -- valves with bilateral symmetry) May occur in chains (planktoic) or filaments associated with mucilage (pennates – tubes or stalks of mucilage) a) b)
Diatoms have silica frustules (“pill box” form) – intricate patterns of pores or areolae (extrude mucilage), ridges, and protrusions. Epitheca (larger) and hypotheca (smaller), joined at girdle. deminuation in mean population size during vegetative growth
Diatom sexual reproductionre-establish population sizeexchange of genetic material gamete formation ––> sex ––> auxospores ––> reset size
Diatoms have a water-filled vacuole –> this changes the relationship between cell volume-to-carbon ratio, in comparison to other species diatoms
Diatoms can dominate marine phytoplankton –– spring bloom species & aggregation flux to sea floor; major vehicle for carbon flux in non-steady state conditions.* blooms spring bloom in open ocean, coastal upwelling, regions of intense tidal mixing, ice-edge spring blooms ocean eddies, iron input events (dust), equatorial divergence, transient open ocean wind-mixed blooms. * post-bloom aggregation and flux to sea floor; globally, diatoms responsible for most of carbon flux (carbon cycle); mucilage produced at end of bloom (nitrogen limitation) Sieracki, FlowCAM, May 2008
Upper: Egg hatch success for Calanus helgolandicus females fed diatom Skeletonema costatum (filled circles) vs. control dinoflagellate Procentrum minimum (open). Lower: % abnormality of hatched nauplii of females feed on diatom vs. dinoflagellate. Photos: TUNEL staining (yellow for apoptosis; cleavage of genomic DNA during apoptosis breaks or nicks, which can be identified by labeling free 3’-OH terminals); females in c, d and e, f were feed S. costatum; g, h were feed P. minimum.Ianora et al., 2004, Nature429: 403
Dinoflagellates - surface is underlain with sacs (alveoli) athecate (very thin scales) thecate (with cellulose scales) Ceratium Alexandrium tamarense
Dinoflagellates (some unique characteristics) * half of species are photosynthetic; half are heterotrophic (+ mixotrophs) *motile active swimmers - 2 uneven flagella, “tumbling” (vertical migrate) * vegetative reproduction (haploid) tend have slower growth rates than diatoms* pigments: chlorophyll a, c unique pigment: in some, peridinin (although others have fucoxanthin - function of evolution of endosymbiosis)* some bioluminescent - startle prey, attract larger predator * some toxic even at low concentrations (Alexandrium <3,000 L-1; Gulf of Maine)* nucleus – highly condensed, lack histones* sexual reproduction –> cysts; overwinter until spring * circadian oscillator
Prymnesiophytes – blooms and DMS producers Phaeocystissingle cell is ~ 10 m colonial form is ~ several mm Coccolithophoridw/ calcite plates or coccoliths http://www.biol.tsukuba.ac.jp/ ~inouye/ino/h/phaeocystis.gif Satellite image Bering Sea (late summer 1997 - El Nino; enhanced stratification involved in bloom; 2 * 105 km2 for 4 months; high scattering had an impact on visual predators - shearwaters, et.) Ca+2 + 2HCO3 –> CaCO3 + CO2
Daughters: radius = 5 mm volume = 524 x 10-18 m3 Mother cell radius = 6.3 mm volume = 1048 x 10-18 m3 How do cells grow? What is growth rate?Phytoplankton obtain energy from photosynthesis, raw materials from nutrients and CO2, synthesis new biomass increase in size.Vegetative growth > cells divide to form two new cells (asexual).Most phytoplankton are haploid (diatoms are diploid). Sexual reproduction serves other functions (other than just increasing #). N is cell number t is time Note: difference in diameter vs. volume (volume is 2X)
Individual cyanobacterial cells measured by flow cytometry at Martha’s Vineyard show diel change in cell size. Increased volume in day (due to photosynthesis); decreased volume at night (due to cell division).
cell number or biomass Growth in a culture (batch) Lag (A); Log (B); Deceleration (C); Stationary (D); Decline (E), death (autolysis?) time log cell number or biomass time (log for “B” region of curve)
Chl (mg m-3) Year Day Year Day Growth in the ocean – does it look a batch culture?Can you measure ‘absolute’ phytoplankton growth rate? Or ‘net’ growth rate (dP/dt = growth – loss) Year Day N. Atlantic spring bloom St. PAPA on-deck incubations to test Fe limitation Lagrangian study of subpolar North Atlantic spring bloom 2009; Chl fluorescence, measured by gliders Welschmeyer et al., 1991, Limnol. Oceanogr. 36: 1631
Chl (mg m-3) Year Day Year Day Why would you want to know phytoplankton growth rate? If you know growth, you can calculate loss: (dP/dt = growth – loss) Loss to: zooplankton, virus, sinking Year Day N. Atlantic spring bloom Lagrangian study of subpolar North Atlantic spring bloom 2009; Chl fluorescence, measured by gliders
Phytoplankton numbers vs. time – moored flow cytometer.Moorings provide Eularian context. Can you use these numbers to calculate growth rate? true growth rate? or net growth rate [dP = growth – loss) dt]? Olson et al., 2003, DSR I 50:301
What controls growth rate?1. Each species has an “intrinsic” limit to maximum growth rate (time between two DNA replications – S phase)2. Environmental regulation of growth rate – absolute requirement for energy (light) and materials (nutrients, CO2).– light, temperature, salinity, nutrients. Note: nutrients will also control biomass (standing stock). 3. Maximal growth rates for phytoplankton ~ 4 doublings/day (NB: this is very high) dP = P (gain – loss) dtdP = P (growth rate – mortality –/+ advection –/+ sinking) Starting point for an estimation pf growth rate (back of the envelope calculation): k = 1.0 doublings d-1 ; m = 0.693 d-1
General trend is phytoplankton growth rate decreases with size.
Light regulates growth rate. General shape of curve is universal; irradiance levels are species specific. Light regulates synthesis of new biomass through photosynthesis. Irradiance Growth rate DSR I 51:1803
Temperature regulates growth rate. As temperature increases, growth rate increases to a maximum (species-specific). Thermal deactivation occurs beyond the maximum. (Is there recovery? Is there adaptation?)
Composite curve of maximal growth rates for number of species.Curve sets an upper limit to growth rate as a function of temperature.Note: growth rate is k,doubling per day.Cultures grown in 24 hours of light. Note Fig. 3.15 in Miller and discussion of differences in data sets.
Growth rates are lower at lower temperature. (Why?)Temperature effects on 1. Rates of enzyme catalysisQ10 = rate at Temperature (X + 10) [in degrees Kelvin] rate at Temperature X [in degrees Kelvin] 2. Temperature mediated-diffusion; seawater viscosity 3. Membrane fluidity NB: there will be some compensation to lower or higher temperature: – increased enzyme concentration – changes in membrane lipids Will global temperature changes lead to change in rates? species replacement?
Temperature affects distribution of species.Prochlorococcus is NOT found at low temperatures (not in polar seas). 10º C seems to be minimum temperature for growth). cells/ ml Partensky et al. 1999. Microbiol. Mol. Biol. Reviews
Growth rate (doublings/day) Interaction of temperature and light:in ocean, there is never only ONE variable (Hutchinson’s Paradox of the Plankton) mmol photons m -2 s-1
Nutrient concentration regulates both rate and maximal potential biomass. Nutrient could be N, P, Si, FeFunctional shape of curve is somewhat similar to light. Growth rate Nutrient concentration
Phytoplankton abundance – how to assess Biomass (state variable)bio – biological or livingmass – grams (in MKS system - meter, kg, sec)Two historical approaches:individuals and bulk measureHow to reconcile the two?How are the two measures used in models and for prediction?
How to measure phytoplankton as individuals? microscopic identification : * microscopic identification to some taxonomic level – light microscope, if cells are large enough – SEM for small cells, not quantitative – epifluorescence (autofluorescence, stains) * image analysis, classification of types by pattern recognition other: * electronic, change in electrical impedance (Coulter Counter) * flow cytometry: light scattering and fluorescence; time of flight; chemical and molecular stains * molecular probes (qualitative) – in situ hybridization & stain
Epifluorescence microscopy http://www.bigelow.org/cytometry/ Chloroplasts (red) in colony of diatom Thalassionema (below). Red chl fluorescenc and blue DAPI nuclear stain. Microscopy of cells (working toward automation w/ image classification). Note morphological variation in Dinophysis acuminata. Synechococcus with PE and Chl fluorescence; epifluorescence counts for small phytoplankton – distinguishes them from detrital particles & heterotrophs
Flow cytometry (from Sosik and Olson)- single cell or particle analysis - multiple optical discriminants (scatter and fluorescence)
How to measure phytoplankton as biomass?so-called “bulk” measure of phytoplankton biomasselements - biogeochemical cycling most elements are found in all living organisms – C, N, P, Si (problem: not unique to phytoplankton), so……… –> convert bio-volume to C, etc. –> apply chlorophyll–to–C ratiopigments, primary chlorophyll a – found only in photosynthetic organisms (mg L-1, mg m-3 or mg m-2) unique chemicals – taxon specific (pigments, sterols, etc.) optics – satellite remote sensing, absorption and scattering
Chlorophyll biomass – proxy for phytoplankton carbon: extract of chlorophyll on ship and in vivo fluorescence in the water 50 15 Extract chlorophyll a:* filter cells * extract 90% acetone* blue light source, red light emission* concentration is proportional to red light emitted Apply carbon -to-chlorophyll ratio(g/g), typically 15 - 50 (but can exceed 50 g/g under high light and low nutrients) cell carbon chlorophyll a Irradiance of growth
Chlorophyll a as proxy for phytoplankton biomass Iron-fertilization experiments with extracted Chl a (g L-1) In vivo chlorophyll a fluorescence for vertical and horizontal distribution of phytoplankton; data collected with underwater glider http://cafethorium.whoi.edu/Fe/1999-Annualreport.html
Regional biomass differences as chlorophyll a (mg chl a m-3) Oligotrophic gyres 0.03-0.15 (mostly ultra and picoplankton) Coastal upwelling 2-16 (nano and netplankton) Coastal shelves 0.5-35 (spring net and nano, summer picoplankton) Equatorial Pacific upwelling 0.2-0.3 (picoplankton) (seasonality; variance high in coastal waters; eutrophication - higher) SeaWiFS chl