Repeated Measure
Repeated Measure. Ideally, we want the data to maintain compound symmetry if we want to justify using univariate approaches to deal with repeated measures (or to block). This variance-covariance matrix is called type S matrix:.

Repeated Measure
E N D
Presentation Transcript
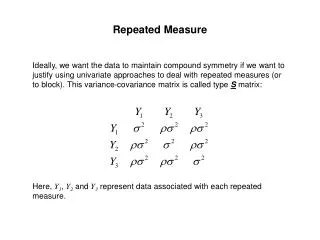
Repeated Measure Ideally, we want the data to maintain compound symmetry if we want to justify using univariate approaches to deal with repeated measures (or to block). This variance-covariance matrix is called type S matrix: Here, Y1, Y2 and Y3 represent data associated with each repeated measure.
Repeated Measure Though, important it is but a subset of a more general condition to be able to use the regular set up of blocking and repeated measure in a univeratiate structure. The more general condition is sphericity (Huynh-Feldt condition) that states that the variance of the difference of any two repeated measurements is constant: This results in a variance covariance matrix called the H matrix. Where, Yi, and Yj represent data associated with some repeated measurements.
Repeated Measure If sphericity holds then we can use the univariate approach and deal with the data as if the repeated measurements are blocks as we stated before (blocks need to conform to this condition as well). How do we know? We can test for it using a test by Mauchly (1940) that is implemented in SAS. This test is distributed approximately Chi^2 with degrees of freedom = (p(p-1)/2)-1), p is the number of repeated measures.
Repeated Measure Example 1: Rabbits are tested for there response to a certain drug with two control factor levels. The drug is Amidaron (a2) and the other two factor levels are vehicle solution (a1) and saline solution (a0), both harmless. Temperature of 15 rabbits that are randomly assigned to these different levels, with a condition that five rabbits are assigned to each level—is taken every 30 minutes at time periods (0, 30, 60, and 90), representing repeated measures levels b0, b1, b2, and b3.
Repeated Measure Disclaimer: The above mentioned test is low power; i.e. its ability to reject the null when the alternative is true is quite small. Hence, according to Kuehl (1994) failing to reject the null doesn’t give much indication to the appropriateness of using a univariate approach unless the sample size is large. Otherwise, the researchers needs to use her/his experience to evaluate the univaraite analysis appropriateness, or just go multivariate.
Repeated Measure • What if Sphericity doesn’t hold, three choices: • Univariate still: • Adjust the F test statistic to compensate for correlated measurements. • Construct contrasts on the repeated measurements. • Multivariate: • Multivariate Analysis.
Repeated Measure Just a note: The Multivariate Analysis of Variance is NOT quite the same as the analysis of Repeated measures (even though we can use Multivariate setup to analyze repeated measure). If the measurements taken on the same individual represent qualitatively different variables, such as weight, height, and shoe size, for the same experimental unit then these are considered multivariate measures.
Repeated Measure Just a note (Cont.): If, on the other hand, the measurements can be thought of as being measurements under different levels of a factor, such as response to medicine 1, 2 and 3 or measurements that are time dependent—then these are considered repeated measurements. In repeated measurements we are interested in comparing the different repeated measurements to one another as well as comparing the main effect of the other factor, in multivariate we are not.
Repeated Measure • Adjust the F test statistic to compensate for correlated measurements. Two available adjustments both are based on a proposed adjustment, e < 0, to the degrees of freedom by Box (1954). Both of which estimate the adjusting factor: Greenhouse and Geisser (1959) use a maximum likelihood approach that tends to underestimate this factor according to Huyhn and Feldt (1976) who provide another estimate for the same factor. SAS calculates both for you!
Repeated Measure • Construct contrasts on the repeated measurements. Use contrasts on the repeated measurements to reduce these measurements to one number, and then use that number in a regular analysis of variance to study the effect of the factor.
Repeated Measure • Construct contrasts on the repeated measurements (Cont.). There are multiple types of contrasts that can be used that can capture the trend in the repeated measurements. These contrasts can actually be used to capture any trend in the means understudy. These contrasts capture the linear, quadratic, cubic ….
Repeated Measure • Multivariate Analysis. The above approaches are a bit within the realm of this class, another approach is to use a multivariate data analysis to analyze the data. This assumes that the measurements are correlated (which they are). SAS provide the REPEATED option that gives one the ability to analyze the data and compare the repeated measurements as well as the main effects, which exactly what we want.
Repeated Measure • Multivariate Analysis (Cont.). Multivariate data analysis introduces tests that are “similar” to the F test statistic that we all know and love. For test statistics are compared usually: Wilk’s Lambda Pillia’s Trace Hotelling_Lawley Trace and Roy’s Greatest Root
Repeated Measure • Multivariate Analysis (Cont.). These are beyond the scope of this class: Though Wilk’s Lambda comes highly recommended by Johnson (1998) because it is based on a likelihood testing approach with good qualities.
Repeated Measure • Multivariate Analysis (Cont.). What does it tell you when these tests are significant? That at least one of the means at one of the levels of each of these repeated measures is different. Remember that you are dealing with a vector of means right now. You will need to do further analysis to see which means really differ. In a way it is like the F test of the equality hypotheses that we have been doing, before going further into analyzing the data. This involves univariate ANOVA’s on the separate variables, among other kinds of analyses.