Download
1 / 17
170 likes | 269 Vues
This study by Emily Young Carr from the Academy of Notre Dame de Namur aims to explore the correlation between pollution levels in local waters and their proximity to industrial areas and high population density. Factors such as industry waste disposal, sewage, and thermal pollution were considered. Water samples were collected from nine different local bodies of water and tested for pH balance, buffering capacity, and bacterial growth. The hypothesis regarding higher pollutant levels near industry and high-density areas was inconclusive based on the study's results. The research utilized various tests and equipment to analyze the water samples and draw conclusions about water quality in different environments.

E N D
Levels of Pollutants in Local Waters Emily Young Carr Grade 9 Academy of Notre Dame de Namur
Problem • Is there a direct correlation between the extent of pollution in local waters and the location of the body of water?
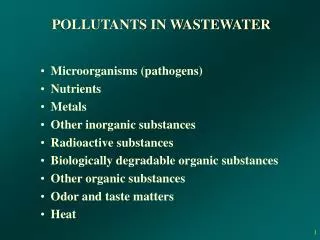
Research • Factors that cause water pollution include… • Industry- many companies dispose of waste in freshwater sources like rivers. • Sewage and Wastewater- increases with a high population density and the presence of industry. • Thermal pollution- when heated water is released into a body of water, often an industrial practice • Some common tests used to evaluate purity of water are pH balance, buffering capacity, and level of bacterial contamination. • pH balance measures how acidic or basic a substance is, 0-14, the higher the more basic. 7 is neutral. • A normal pH measurement for freshwater should be between 6.5 and 8. • Major or sudden changes in pH balance are stressful for the water’s ecosystem.
Research • Buffering Capacity is the amount of acid or base needed to change the pH balance of a solution. • A high buffering capacity indicates the water tested is hard water while a low buffering capacity indicates soft water. • Hard water is water with a high mineral content (common minerals are calcium and magnesium); soft water is the opposite. • Water pollution is not linked with only hard or soft water.
Hypothesis • If a body of water lies in close proximity to industry, and/or there is a high population density in the area, then higher levels of pollutants will found in the water.
Necessary Materials • 9 sterile 50mL conical tubes • 27 sterile 14mL round-bottom tubes • Pipettes of varying size • Pipette aid • 9 LB agar plates • Bacteria loops • 54 mL of LB broth • Diluted HCl at .02 N HCl • pH meter • Shaker incubator • Bunsen burner with fire source • Cold room • Water from 9 different local bodies of water
Procedure (Water Collection) • Eight local bodies of water were chosen from which to collect water samples. • The first five samples were collected from suburban bodies of water. The bodies of water from one to five are: Darby Creek, Harriton Plantation Pond, Rhoads Pond, Dove Lake, and Mill Creek. • The remaining three samples were collected from urban bodies of water. The bodies of water from six to eight are: the Delaware River, the Schuylkill at the Boathouses, and the Schuylkill at the Gladwyne Exit. • All samples were gathered in 50mL conical tubes.
Procedure (pH balance) • The pH meter was standardized to pH7. • The pH of the eight water samples and the control were tested. • Tests were done three times for each sample for statistical significance. • The probe was cleaned after each sample was tested.
Procedure (Buffering Capacity) • 14 mL tubes were filled with 2 mL of water sample per tube, 3 tubes for each water sample • The pH meter was standardized to pH7. • Acid (HCl) was added in μL increments to the water sample until it reached the neutral measurement of pH 7 • HCl Concentration: 0.02 N HCL • Tests were done three times for each sample for statistical significance. • The probe was cleaned between tests.
Procedure (Bacterial Growth) • 14mL tubes were labeled 1-9 with 3 tubes per water sample. • The tubes were filled with 2mL of LB broth and then 20μL of water sample was added using a pipette aid. • The 27 tubes were put into a shaker incubator at ideal bacterial growth conditions and left in overnight. • 37 degrees C • 9 LB agar plates were separated into thirds and the thirds were labeled A, B, and C. • Plates were streaked, each of the three bacterial cultures for a water sample were put into a different third. • Plates were stored in 37 degrees C oven and bacteria was allowed to grow overnight. • Plates were evaluated for bacterial colonies the next day.
Variables • Independent Variable- the water samples from varying bodies of water • Dependent variable- pH balance, buffering capacity, and bacterial growth • Control- tab water from laboratory facility • Constants- the materials used; the amount of water sample collected; the amount of LB broth used per sample; the temperature of the lab facility, cold room, shaker incubator, and water samples; the location of experimentation; and the amount of time allowed for bacterial growth and observation
Data and Results • Abbreviations: • Darby Creek: WS1 • Harriton Plantation Pond: WS2 • Rhoads Pond: WS3 • Dove Lake: WS4 • Mill Creek: WS5 • Delaware River: WS6 • Schuylkill at Boathouse: WS7 • Schuylkill at Gladwyne Exit: WS8 • Tap Water from a Lab Facility: Control
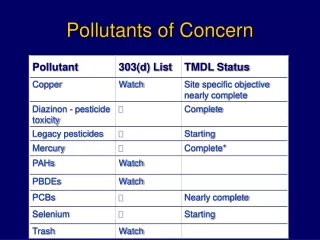
Conclusion • Hypothesis- If a body of water lies in close proximity to industry, and/or there is a high population density in the area, then higher levels of pollutants will found in the water. • The hypothesis was neither supported nor unsupported • Results too vague to clearly support correlation • Higher percent of urban bodies of water had bacteria, but some suburban bodies of water had bacteria also • Did not consider extent of agricultural pollution • Possible Errors and Improvements • There should be a greater number of water samples from both groups • More tests could be preformed to test pollutants in water
Recognitions • Thank you to all sources used. • Pollution by Debra A. Miller • “EPA to Staunch Flood of Storm Water Runoff Polluting U.S. Waterways” Scientific American • “Water Pollution” http://en.wikipedia.org/wiki/Water_pollution • “Water Pollution and Society” http://www.umich.edu/~gs265/society/waterpollution.htm • “On Course for a Cleaner Hudson” The New York Times • “Optimum Freshwater pH” http://www.bestfish.com/tips/102998.html • “Hard vs. Soft Water Explained” http://www.freedrinkingwater.com/water-education • “The Causes of Water Pollution” http://www.water-pollution.org.uk/causes.html • Thank you to everyone in the audience for listening to my presentation. I would be happy to answer any questions you may have about my project.